Signal-to-noise ratio in spectrometry
One important property of optical devices, including spectrometers, is the signal-to-noise ratio (abbreviated SNR). But what exactly does the SNR describe and how can we use it to compare different [spectrometers]{filename}/pages/spektralwerkcore.md)?
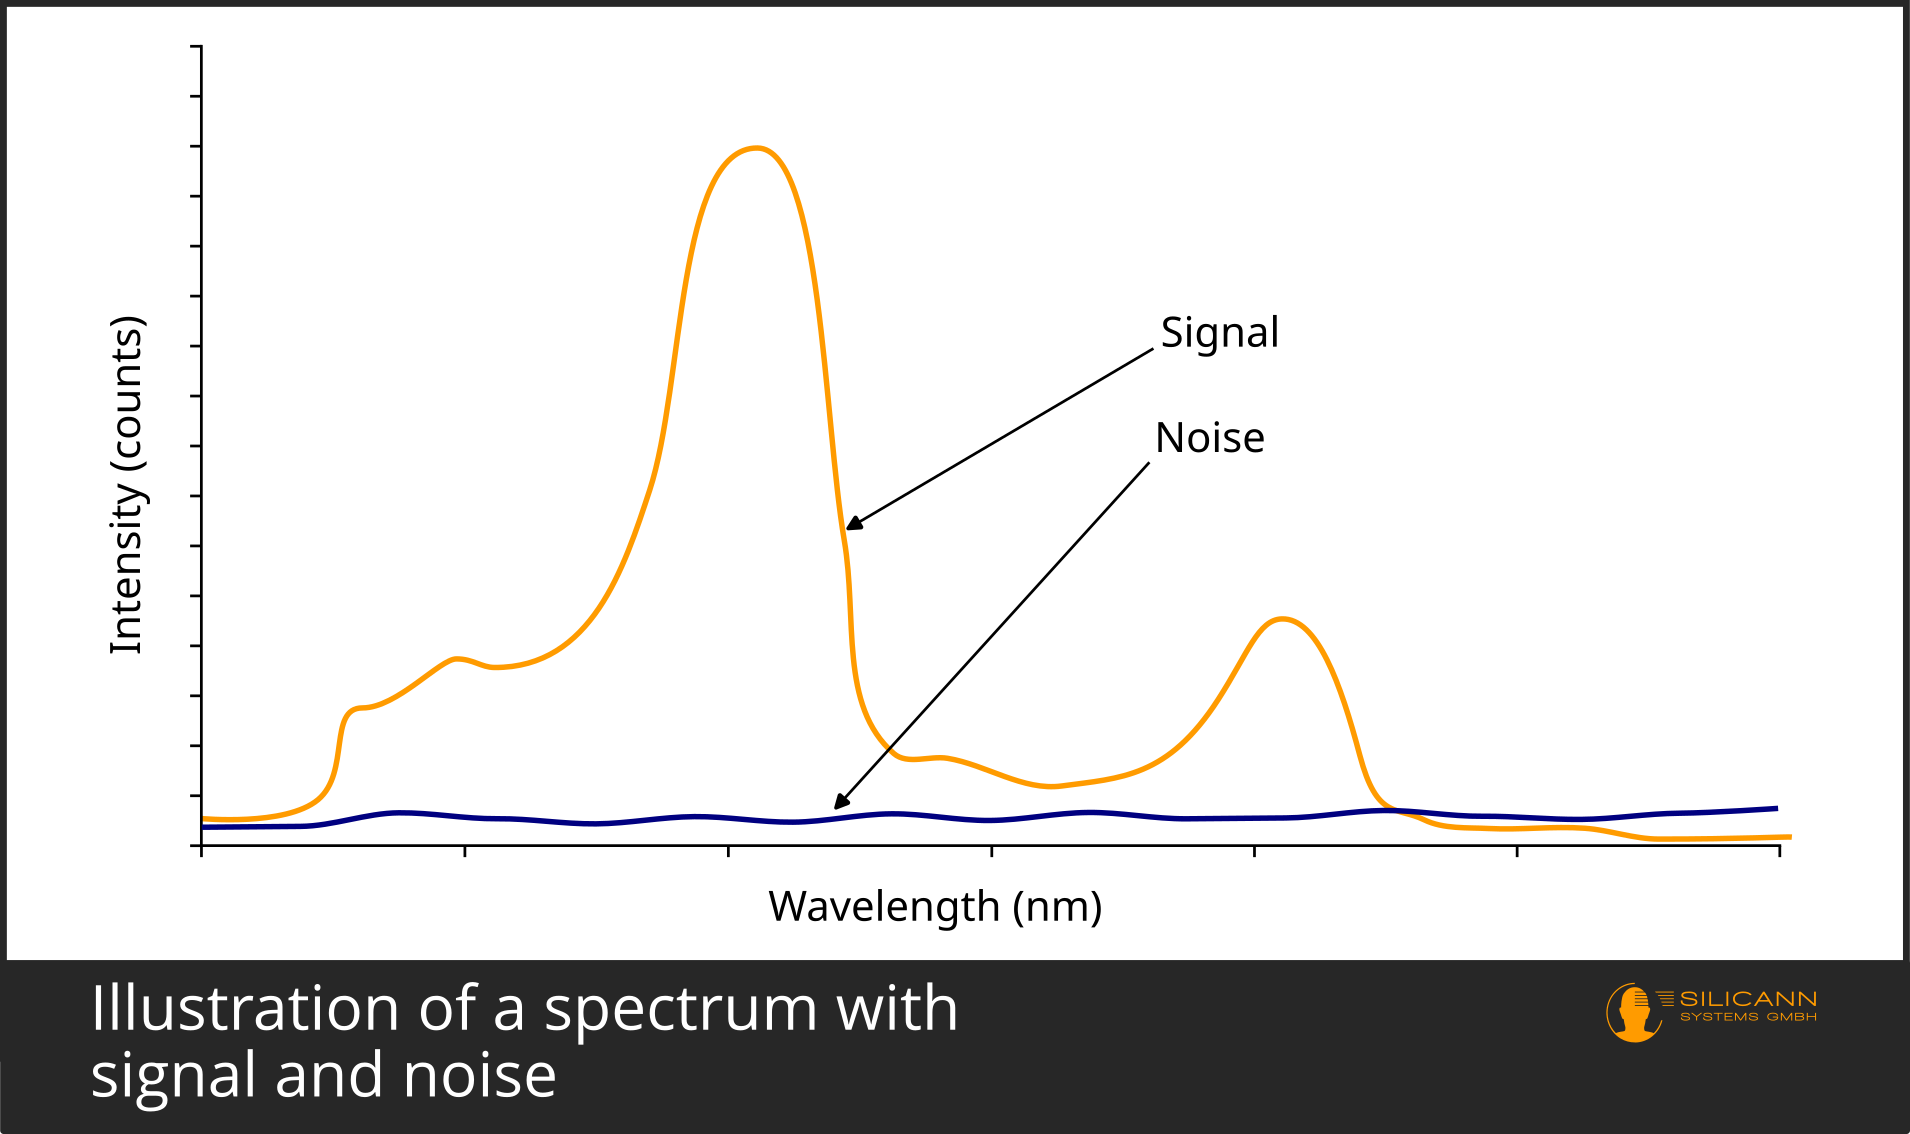
The signal-to-noise ratio measures the difference between the desired useful signal and the unwanted background noise of a sensor. In spectrometry and similar optical fields, the SNR is usually a dimensionless quantity, i.e. the numerical value is not followed by a unit. In addition to spectrometry, it is also used in many other areas. There, e.g. in audio processing or communications engineering, the signal-to-noise ratio is defined somewhat differently and then has the unit decibel (dB).
So a high signal-to-noise ratio is better - so why a whole article on the subject? As always, the devil is in the details: What signal exactly is being detected, under what conditions is the measurement being made (e.g. real-world or ideal conditions), does the SNR apply to the entire spectral range or only to a favorable section of the spectrum? In order to be able to meaningfully compare SNR values of different devices, the conditions under which the signal was read out and the signal-to-noise ratio calculated must also be similar.
From radiation to signal
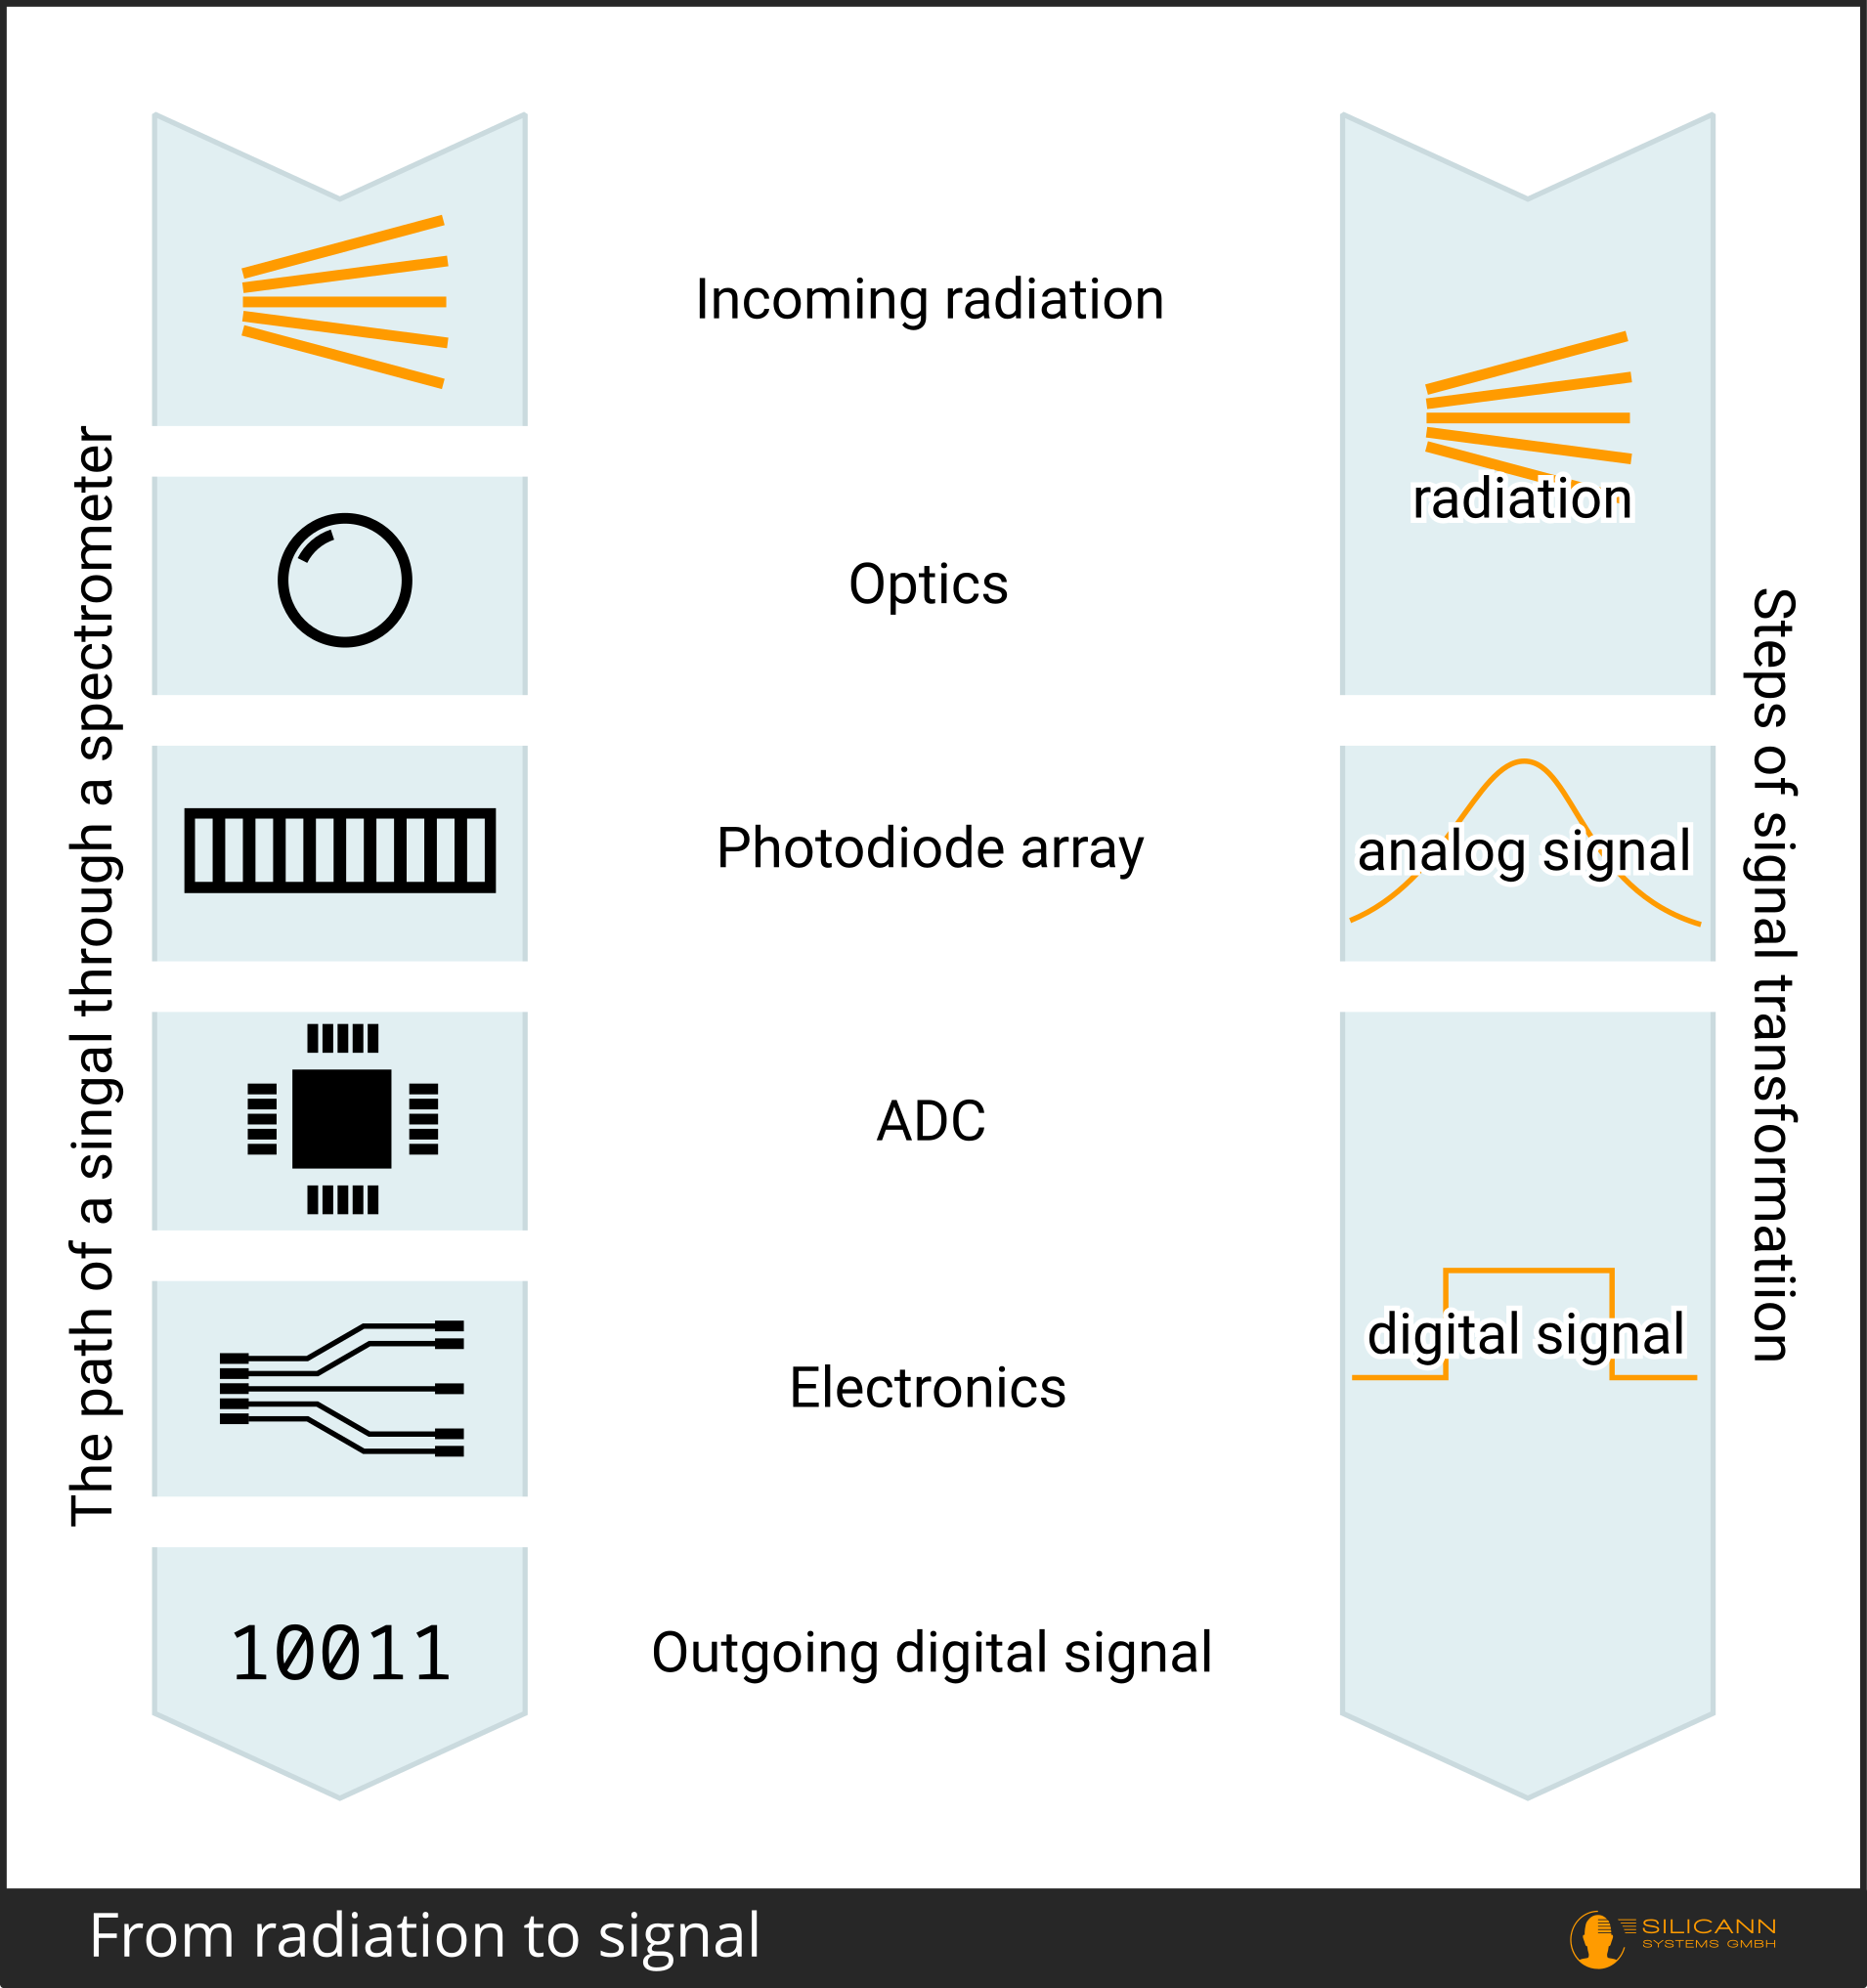
As a reminder: In spectrometers, light, i.e. electromagnetic radiation, hits the entrance of the device, passes through the optical structure, is fanned out by wavelength and finally reaches the photodiode array. This array consists of individual light-sensitive pixels, whereby each pixel only receives a specific wavelength range. Alternatively, mainly in laboratory devices, there is also the classic setup with just one photocell, to which the individual wavelength ranges are then directed one after the other thanks to a movable prism. Whether one pixel or many, the incoming radiation is now converted into electrical voltage at this point.
Now there is already a signal, but this signal is still analog. In the next step, it is converted into a digital signal using an analog-to-digital converter (ADC). The ADCs used here almost always have a resolution of 16 bits. In other words, they can output a maximum of 2^16 = 65536 different values (counts).
This means that we have already captured the theoretical ideal case: A signal of maximum strength of 65535 (because the scale starts at zero), and a minimum noise of one count results in a signal-to-noise ratio of 65535:1. We ignore the special case completely without noise at this point because of the division by zero - there is no such thing as a spectrometer completely without any noise anyway.
Why not?
There are various points along the signal processing chain where noise can degrade the signal. Let's take a closer look at how the radiation is converted into a digital signal.
The radiation hits the atoms in the photocell in the form of photons. The energy of a photon is now absorbed by the atom it hits. This pushes an electron of this atom to a higher energy level. In a simplified model, the electron can be imagined as being in a higher orbit, less bound to the atomic nucleus around which it was orbiting.
This is the photoelectric effect, and the electrons mobilized in this way are called photoelectrons.
The pixels in the sensor array of the spectrometer consist of a semiconductor material that has been deliberately contaminated (doped) with traces of a substance. This substance consists of atoms that have fewer electrons than protons. They therefore lack electrons. The mobilized electrons are captured by these atoms.
Once captured, the electrons can be released at the touch of a button, a voltage is generated, which is then recorded by the ADC converter and converted to a digital value between 0 and 65535.
Dark shot noise
The problem is that the measured light is not the only factor through which energy reaches the sensor pixels. Other factors also involuntarily cause the electrons to be released. The most important factor here is radiation, which is not part of the signal we want to measure. It is present even in the darkest room, especially in the form of heat. It can be found in any measurement situation that is above absolute zero. And the spectrometer itself, just like the light source, for example, also produces waste heat as soon as it is switched on.
This thermal radiation is the most important source of noise. It is referred to as dark shot noise or dark noise because it can also be measured in a completely darkened test setup, i.e. without any ambient light.
Dark noise therefore occurs at the very beginning of the signal processing chain. It can essentially only be reduced by minimizing this thermal radiation. When designing the spectrometer, but also the measurement situation as a whole, it is therefore important to ensure that all heat sources are isolated from the sensor array itself as far as possible. In a next step, the spectrometer can then be cooled in order to further reduce the dark noise.
Read noise
In addition, interference also occurs during the translation of the incoming photons via the analog signal to the digital signal. These are usually referred to as read noise or readout noise. The triggers are similar to those of dark noise, mainly the temperature of the system and the length of the exposure time, with longer exposure resulting in stronger noise.
Interference with the digital signal
Once the signal has been digitized, the susceptibility of the data transport to interference is also reduced. However, the problem is still not completely solved. Inaccuracies in the clock signal with which digital components such as the ADC are operated can affect the regularity of the readout intervals. This can distort the signal because slightly more or fewer photons are then collected for this unit of time than would actually have occurred in the time span.
In addition, the digital signal transmission itself is influenced by electromagnetic radiation originating from other components of the spectrometer itself or from its surroundings (electromagnetic interference). It is also possible to be influenced by cables in the immediate vicinity within the device (crosstalk). However, these two potential sources of error can be greatly reduced with a well-thought-out hardware design.
SNR dark: Determine signal-to-noise ratio without light
In a spectral measurement, all these and other sources of error not mentioned here will influence the signal. They are all recorded in their interaction as an aggregate noise level.
A simple way to determine a signal-to-noise ratio is to take a measurement in complete darkness. If no light from outside hits the sensor array at all, then we only measure the noise. For simplicity, the theoretical maximum of 65535 is assumed as the signal.
This results in a very high signal-to-noise ratio, which looks very good in data sheets. This is one of the reasons why it is often used in spectrometry. Indications that the SNR was determined in this way are terms such as dark measurement or SNR (dark).
Calculation of the dark signal-to-noise ratio. S is the signal, assumed to be a constant 65535, D is the dark spectrum, σ is the median of the standard deviation of the dark spectrum.
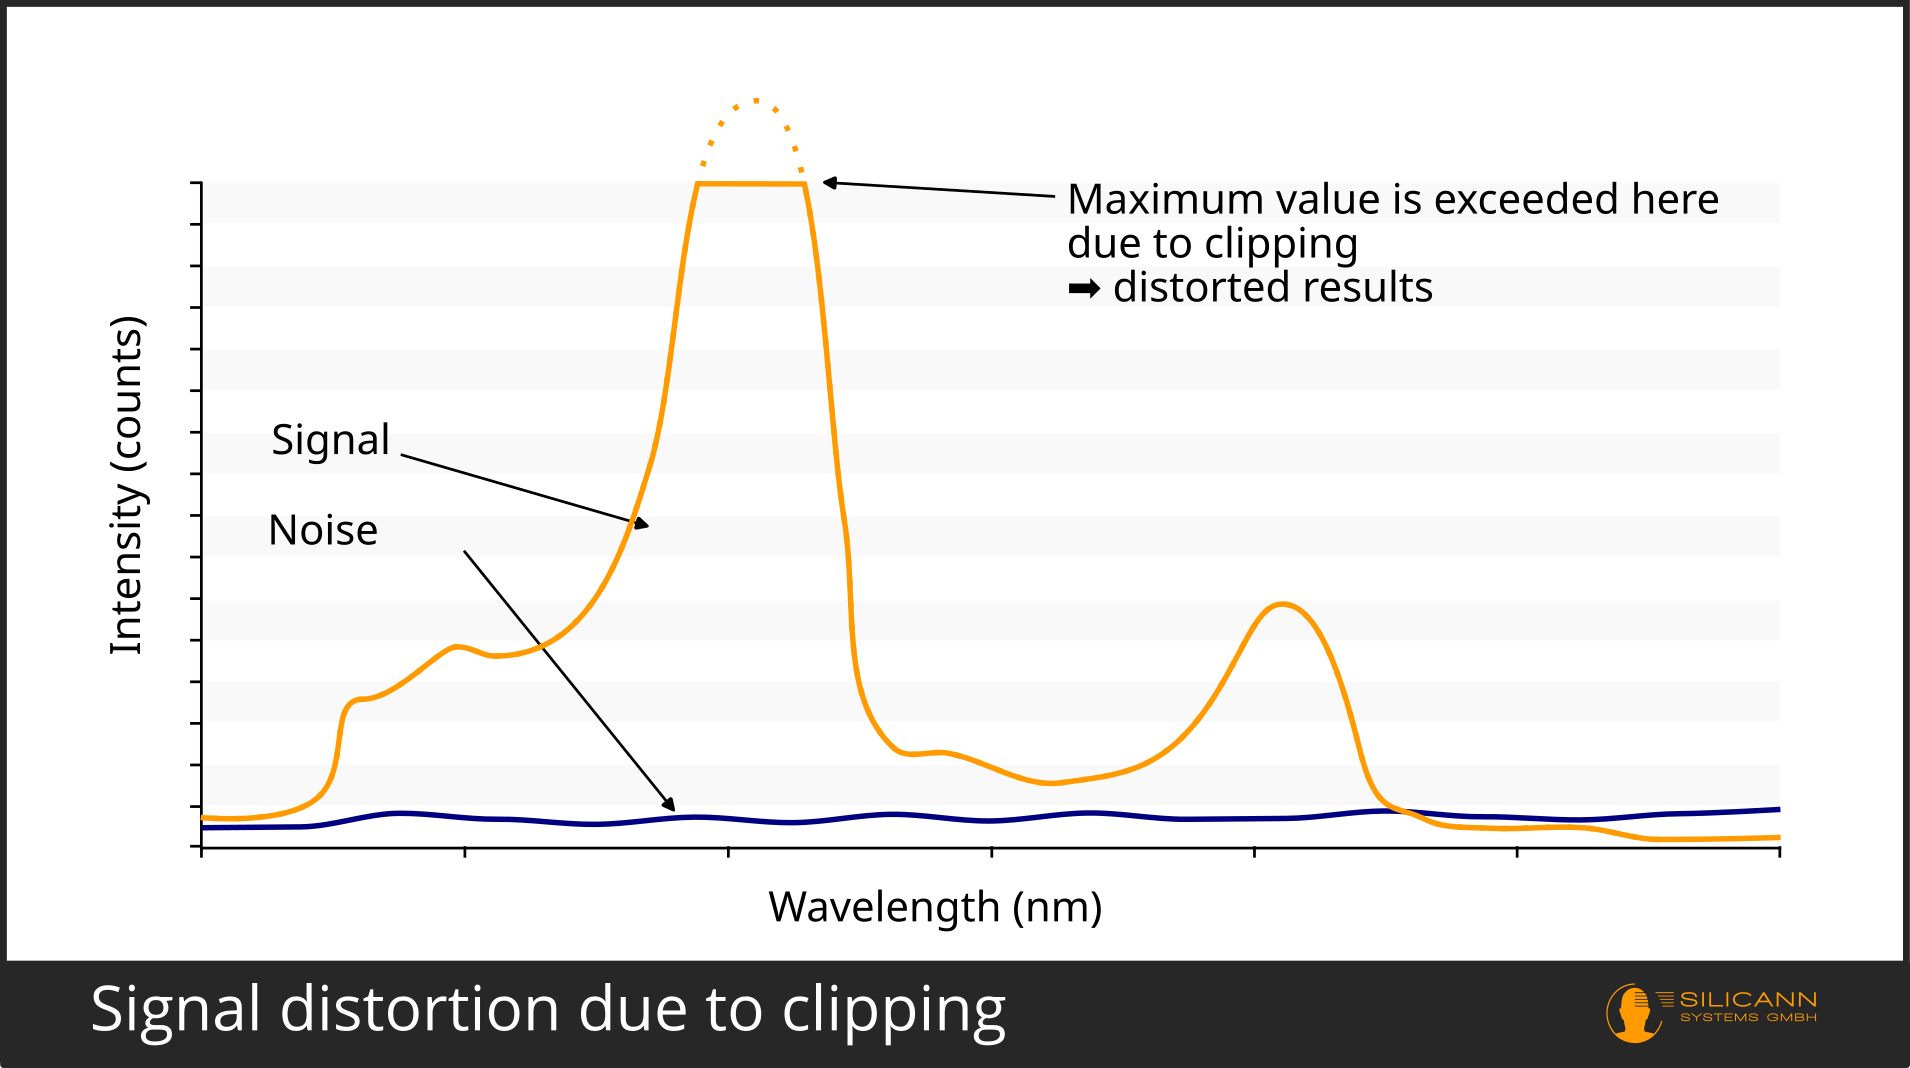
Although the noise in this calculation is indeed real, the assumption of a perfectly and maximally controlled signal is not very realistic. In practice, the signal of our interest will practically never be completely stable. If we were to adjust the amplitude in such a way that we achieve the maximum possible counts, we would always expose our measurement to the risk of cutting off the peak and thus falsifying the measurement.
Furthermore, in practice, this maximum level comes at an unplanned cost: a longer exposure time, for example, also increases the noise that we measure.
However, the SNR dark also has a legitimate advantage in addition to the large numerical value: it is relatively easy to compare across different devices and measurement scenarios, precisely because a fictitious but always identical signal is assumed rather than a real signal that fluctuates depending on the situation. This is probably one of the reasons why it is used by many manufacturers to characterize their spectrometers.
SNR light: Calculate signal-to-noise ratio realistically
However, it is more realistic to spectrally measure a real signal source. In this case, the measurement setup is designed in such a way that as much radiation as possible reaches the sensor array - but not so much that the possible maximum value is reached. If we were to see maximum counts throughout, this would ultimately just be a complicated dark measurement.
In order to firmly define the noise, the pure noise itself is recorded beforehand, as with an SNR dark measurement, and then subtracted from the determined signal.
Calculation of the signal-to-noise ratio light. S is the signal actually measured. D is the previously measured dark spectrum. σ is the standard deviation of the signal.
A signal-to-noise ratio determined in this way will be significantly lower than a dark measurement. An SNR dark of one and the same device can easily be several times greater than a realistic SNR light. This becomes immediately clear when looking at the formula: If the signal is only controlled to a maximum of 30000 counts, then the resulting signal-to-noise ratio is only less than half as high. However, the SNR light is at the same time much closer to the situation in the field, in which the signal will rarely occur in the form of perfect, maximally radiating deflections.
What else influences the SNR formula?
Signal-to-noise ratio over the entire spectrum
Until now, the signal-to-noise ratio was treated as if it only affected a single wavelength and a single photosensitive pixel. This is of course not the case with a spectrometer. In reality, the SNR is therefore usually calculated for the entire spectrum. This is simply done by averaging all values. Spectrometers are very often less sensitive at the edges of the wavelength range and therefore have a poorer signal-to-noise ratio there.
Averaging over the entire wavelength range of the spectrometer can therefore lead to a lower signal-to-noise ratio. Unsurprisingly, in practice you occasionally come across manufacturers who restrict the signal-to-noise ratio of their device to certain wavelength ranges. This is not necessarily cheating and is not a disadvantage if the wavelengths required in the application are in this range. However, it should be taken into account. For physical reasons, the sensitivity of spectrometers will always flatten out towards the edges, and it is ultimately at the discretion of the manufacturer how wide the edge range is that is made accessible for the application.
Sometimes, however, the signal-to-noise ratio is indeed only measured over a single wavelength or pixel of the sensor array. It is then necessary to read between the lines of a datasheet, as this is not usually explicitly formulated. The one pixel is then of course the one with the minimum noise or maximum sensitivity. Indications pointing in this direction are keywords such as min or max after the SNR specification.
SNR and the number of measurements
In practice, however, we rarely measure just once, but usually carry out several measurements of the same sample, for example to counteract inhomogeneous sample surfaces. The results of these measurements are then also averaged. The higher the number of individual measurements, the higher the standard deviation. And this is reflected in the signal-to-noise ratio.
Put another way: The fewer measurements are averaged, the better the resulting signal-to-noise ratio will look. The number of measurements included in the signal-to-noise ratio therefore plays a major role when comparing devices.
The measurement setup influences the signal-to-noise ratio
Last but not least, there are also some pitfalls lurking in the measurement setup itself, first and foremost temperature drift. The spectrometer will heat up during operation. As described above, this leads to increased background noise and therefore inevitably to a poorer signal-to-noise ratio.
The same can apply to the light source. It also generates noise, and this noise can be amplified by its own heating. If the light source is noisy, this noise will inevitably also affect the measurement by the spectrometer. In addition, the light source also radiates its heat, and this can also influence the spectrometer, depending on the arrangement in the measurement setup.
In an ideal world, the entire system, i.e. spectrometer, light source and sample, would always be at an exactly constant temperature that is as low as possible.
Influences on the signal-to-noise ratio summarized
In order to be able to compare the signal-to-noise ratio across different manufacturers, the following information must be available:
- was the signal-to-noise ratio measured dark (i.e. without a real signal) or light? If light, i.e. measured with a real signal: at what signal intensity?
- at what temperature?
- over the entire wavelength range?
- over how many measurements?
In total, these factors can influence the signal-to-noise ratio of one and the same spectrometer by a factor of 10.
It is important to consider whether the conditions mentioned are suitable for your own measurement situation. For example, a temperature of -20 °C can be realized in a laboratory setup, but this becomes more difficult when continuously measuring an industrial process with boiling temperature.