Spectrometer
Light contains much more information than can be perceived with the naked eye. We see light as colors, so we are able to differentiate between different wavelengths of light. We can recognize colors because there are light-sensitive cells, the cones, in the retina of our eye. There are three different variants of these cones in the human eye, which have their respective sensitivity peaks at different wavelengths. The colors themselves are a pure construction of our brain - the wavelengths themselves do not contain any color information. If the molecules in the cones were sensitive to other wavelengths, then the leaves on the trees would appear yellow to us, for example, or the sun green.
The wavelengths of visible light are divided into three wavelength ranges by our eyes thanks to these cones, and we use this information intuitively to distinguish between substances in our environment, even if they have the same shape.
A spectrometer works in a very similar way: here too, the wavelengths that make up a beam of light are divided into individual wavelength ranges in order to obtain more differentiated information about the observed object. In contrast to our eyes, however, the light in a spectrometer is not only divided into three wavelength ranges, but usually into a three-digit or even four-digit number of very narrow bands.
The different wavelengths that make up a light beam are very rarely all equally intense. This even applies to the light of the sun, which our eyes have evolved to perceive. However, because our eyes can only distinguish the individual wavelength ranges very roughly, they can also be easily deceived by different variants of artificial light sources. For example, fluorescent tube lighting is indistinguishable from sunlight at first glance, even though it only emits very narrow but all the more intense wavelength ranges:

For everyday life, the light source usually makes little difference. For the production of paints, varnishes and materials of all kinds, however, it does: depending on the nature of the light sources, products can look completely different under the light in the production hall than in daylight. This effect is called metamerism. It is generally undesirable because the aim is to ensure that different batches of a product look identical, for example, or that a plastic element on an e-bike cannot be distinguished from the painted metal frame in terms of color.
How does this color shift occur in the first place? The color impression we get from tomatoes on the supermarket shelf, for example, is not just due to the tomatoes themselves. Ripe tomatoes appear rich red to us because the red part of the light that shines on them is reflected by them and reaches our eyes. Sometimes the tomatoes are not yet fully ripe and their color therefore still has a stronger green component. Then the same applies: this wavelength range must have been present in the original light in order to be reflected by the tomato skin. Supermarkets like to take advantage of this fact by using light sources that emphasize the full red and sometimes make the fresh produce appear riper than it actually is.
Color spectrometers: Measuring color instead of testing it
Spectrometers make it possible to avoid these limitations from the outset: A color spectrometer can initially resolve the wavelengths of the light source so finely that the respective intensities per wavelength can be recorded. The idea here is that an object can only reflect as much green as was first radiated onto it. So if only half as much green is emitted by the light source compared to the brightest wavelength, then the proportion of green reflected by the object must be mathematically doubled in order to obtain the objective reflection. In this way, a spectrometer can be used to predict what an object will look like under sunlight, a neon tube or under LED lighting: The color can be objectively measured instead of just tested.
However, the light returned by different materials contains far more information than just the color impression. In the early 19th century, during optical experiments with sunlight and prisms, Wollaston and Fraunhofer independently discovered that in the rainbow colors of a fanned-out spectrum, narrow black lines can be seen at various points where individual narrow wavelength ranges are apparently missing in the spectrum. The number and position of the individual lines were always unchanged, regardless of how and where the experiment was repeated. Only when the light source was changed - either to other stars or different burning materials - did different line patterns emerge. Nowadays, these lines are usually referred to as Fraunhofer lines. They arise because the individual wavelengths at these points in the spectrum were absorbed by different atoms and were therefore missing in the captured light. In other words, by precisely analyzing such spectra, we can gain insights into the properties of a wide variety of materials. The discovery of the Fraunhofer lines thus marks the birth of modern spectroscopy.
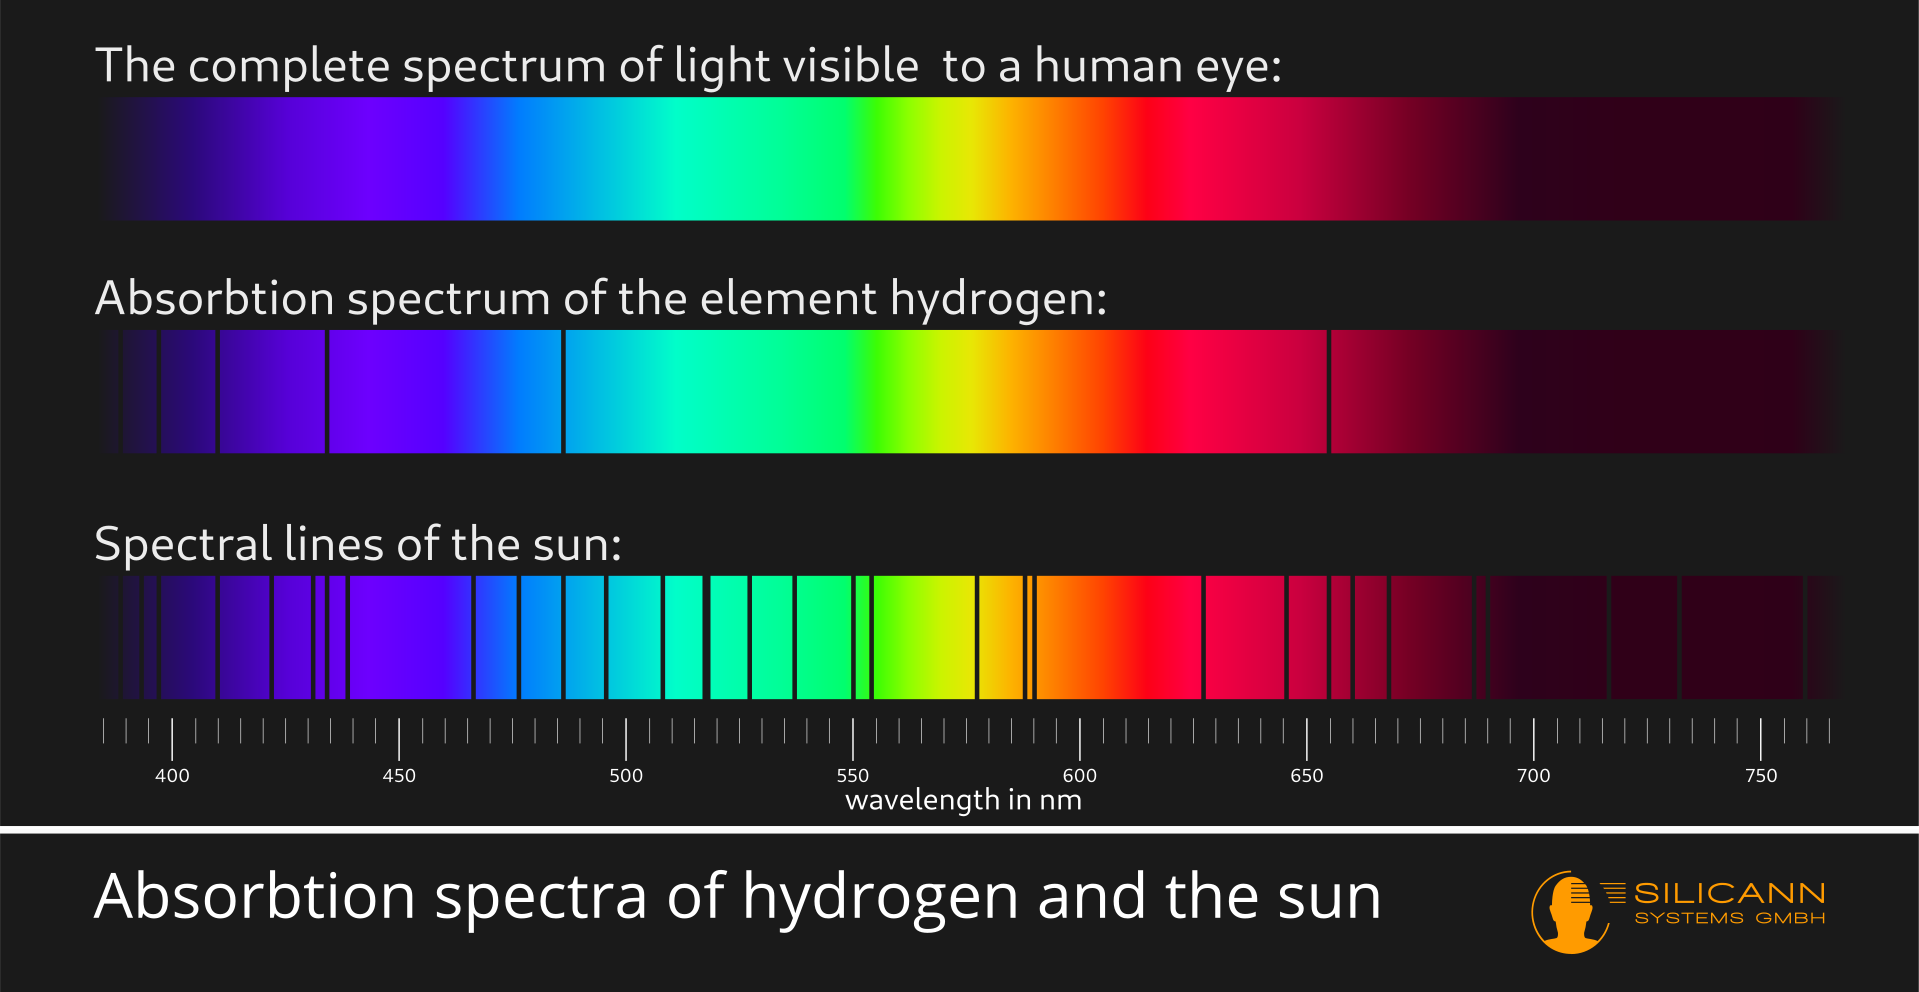
Spectrometry allows us to gain deeper insights into different substances because the specific properties of individual atoms or molecules determine exactly which wavelength interacts with them. At the atomic level, this interaction usually consists of the lifting of individual electrons to a higher energy level. Depending on the structure of the atom, i.e. the number and position of the electrons, very specific amounts of energy are required for this. This energy is supplied by the photons in the light beam, and the transported energy of the photon depends on its wavelength. One of the quantum mechanical phenomena is the fact that the electrons must receive the exact right amount of energy in order to be raised to a different energy level. This means that they cannot collect the energy from several photons and thus cover part of the distance. Instead, the principle all or nothing applies, either the amount of energy fits or it does not. This means that only very specific wavelengths are absorbed by the atom - and that is why there are clearly defined, narrow Fraunhofer lines in the spectrum.
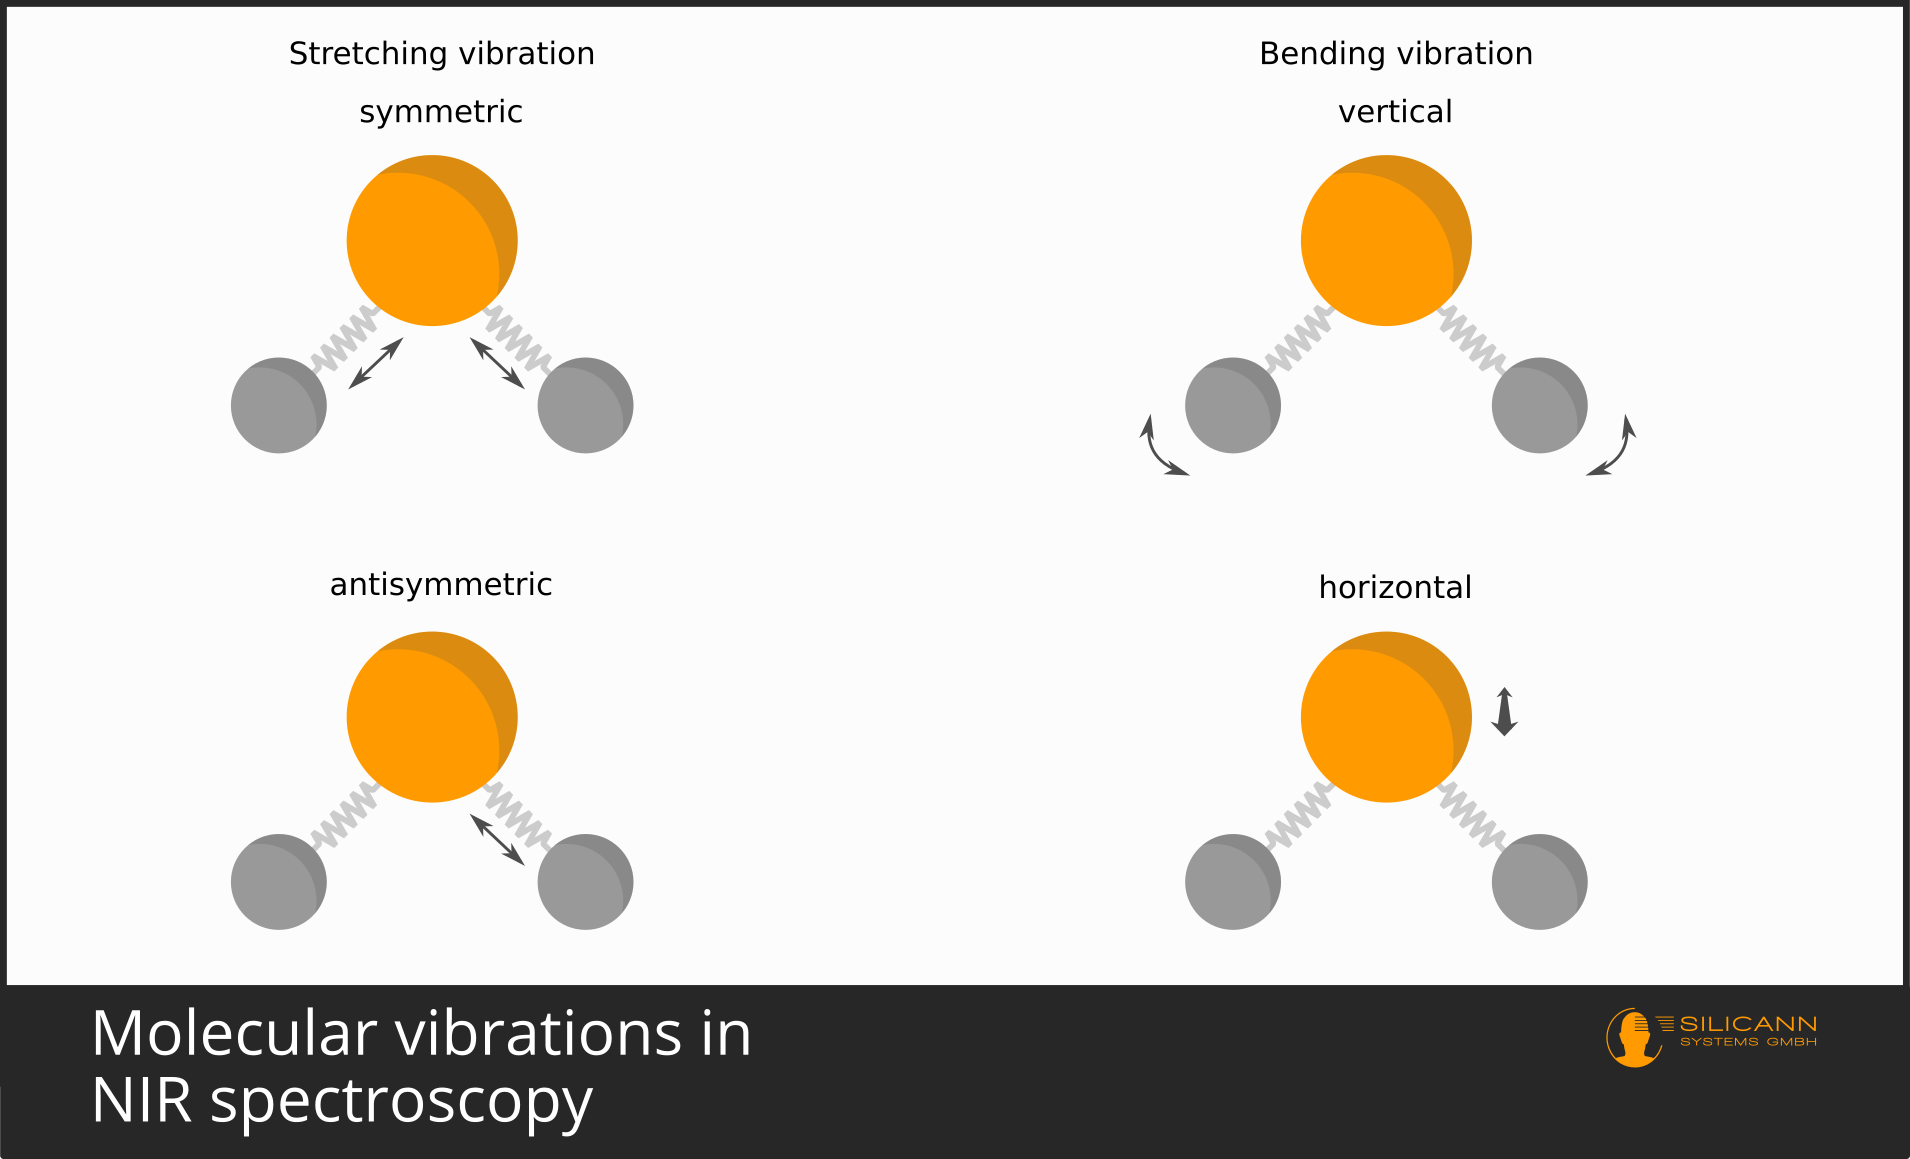
When interacting with molecules instead of atoms, the situation is basically very similar. Here, the excitation by the radiation causes the individual atoms that make up the molecule to vibrate back and forth relative to each other. Depending on the complexity of the molecule, many different types of movement are possible: stretching, compression, rotation and more. This is why molecular vibrations do not usually show up as clearly in the spectrum as electron transitions at atomic level, but instead describe broader curves due to the superimposition of many individual molecular movements.
The interaction of radiation and matter basically always follows the same pattern. However, there are different measurement variants. In emission measurements, an object is analyzed that is itself a source of radiation, for example stars, candles or LEDs. Here, the emitted spectrum itself is recorded. This may also result in absorptions such as the Fraunhofer lines. The substances that absorb the individual wavelengths can then be found in the radiation source itself or in the air between the light source and the spectrometer. The former is the case with the spectra of stars. This is why spectrometers are indispensable in astronomy, as they help us to gain far-reaching insights into the material composition of distant stars.
Alternatively, we can place the light source itself and then observe how its spectrum changes when it interacts with the substance of interest. This interaction can essentially take place in two ways: by transmission or by reflection. In the case of transmission, a transparent material, usually liquids or gases, but also glass or various plastics, for example, is illuminated from one side and the light is analyzed after interaction with the material. Here too, the rays will excite electrons or cause molecules to vibrate, resulting in lower intensities at specific wavelengths of the resulting spectrum. Alternatively, in the case of opaque materials, light is shone onto the surface of the sample and the subsequently reflected light is recorded with the spectrometer. The light again penetrates the material, excites atoms or molecules there and therefore, as with transmission, also contains spectral information that can provide information about the nature of the sample.
How does a spectrometer work?
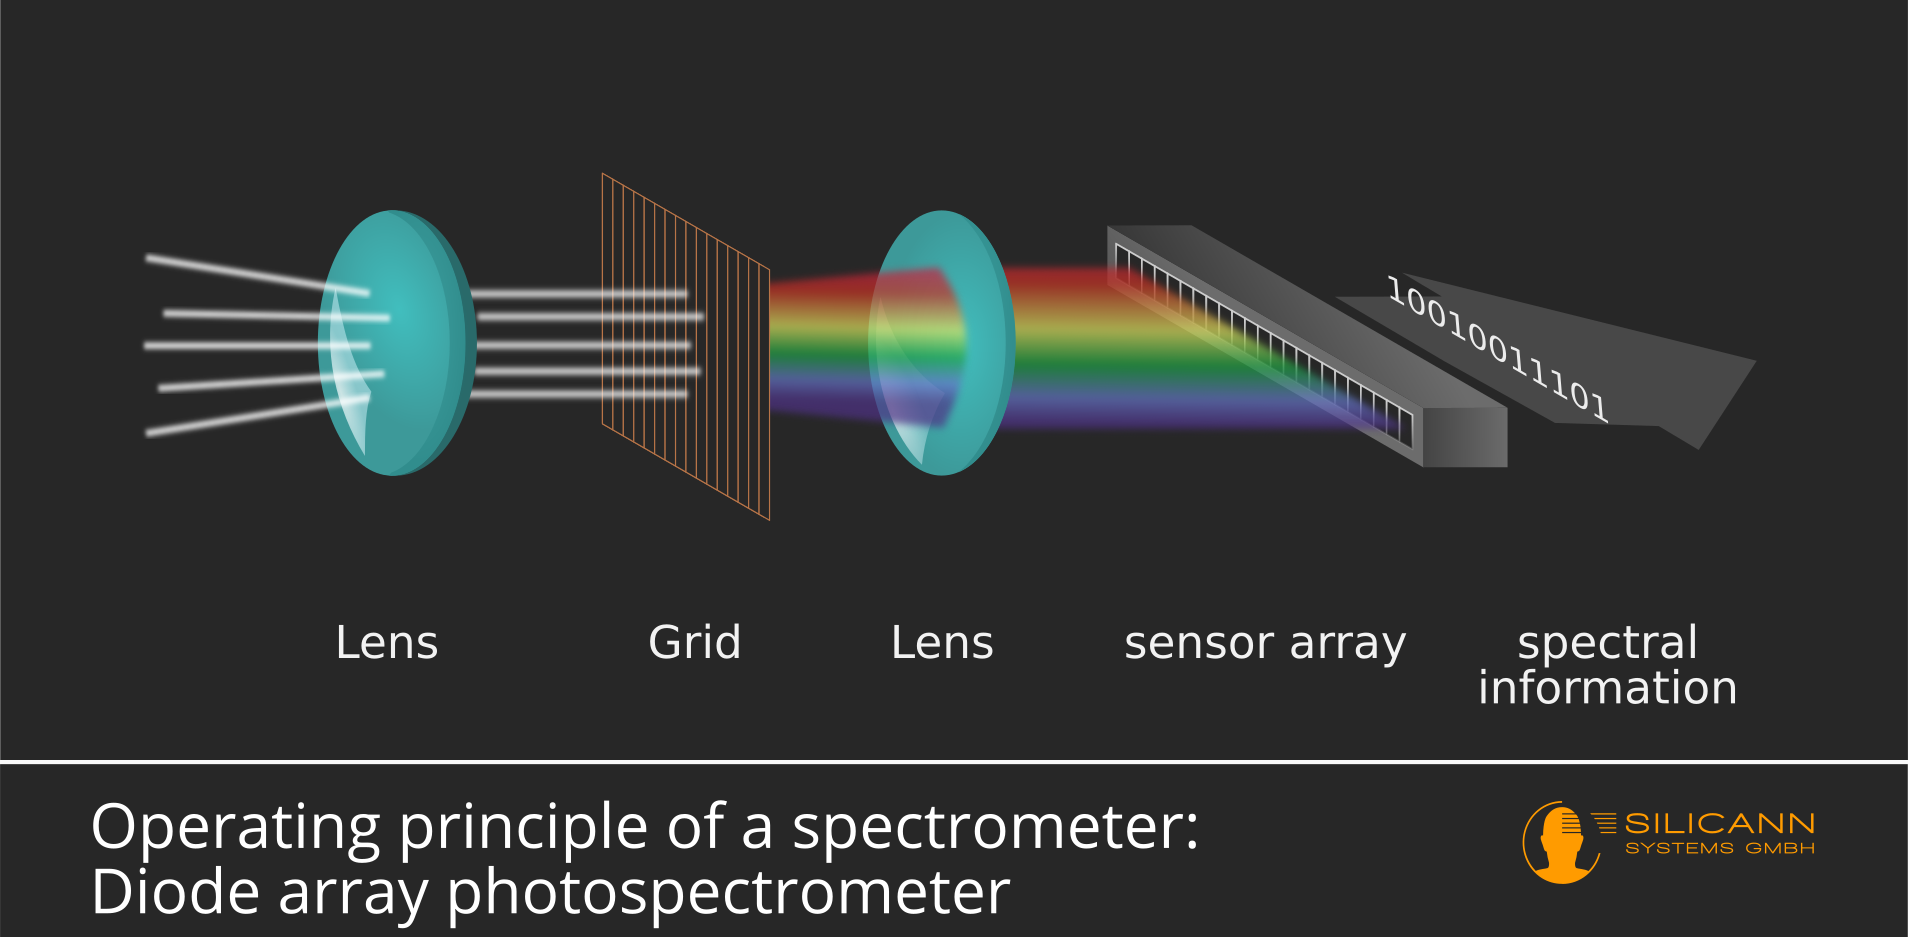
A spectrometer provides information about the intensities of individual wavelength ranges. However, the light stimulus to be measured consists of many overlapping light beams, which may also be reflected in different directions. These beams must therefore first be parallelized. A lens is used for this purpose, as illustrated in the picture below.
After passing through the lens, the light beams are now parallel to each other, but individual beams of different wavelengths are still superimposed. This is why the beam is guided through an optical grating or diffraction grating. An optical grating can actually be imagined as a grating, but the dimensions are extremely small: the width of the slits is usually only a few µm.
The light rays are diffracted as they pass through the grating. The strength of the diffraction of light is partly dependent on the wavelength: The greater the wavelength, the stronger the diffraction. This means that the light beam is fanned out at the optical grating according to wavelength.
However, the resulting beam still has a two-dimensional cross-section. Because the sensor lines waiting at the end are actually lines, i.e. arranged in a linear fashion, a second lens must focus the circular beam in such a way that as much of the light as possible falls on the sensor.
The sensor consists of a series of individual cells. As a light beam fanned out according to wavelength hits the sensor, only certain wavelengths reach the individual cells. The cells themselves now simply count the incident photons and an electrical signal is delivered at the output of the sensor line, which outputs the intensity measured for each cell.
In the classic design of a spectrometer, there is only a single photodiode instead of this diode array. This diode reacts (approximately) equally strongly to light of different wavelengths, i.e. it can only provide information about the quantity of incoming photons, not about their wavelength. When setting up a diode array, only a certain wavelength range of light automatically hits a single cell in the array. If there is only a single photodiode, the spectrum must be filtered in a previous step so that only a narrow wavelength range hits the diode at any one time. In the classic setup, this task is performed by a movable prism in conjunction with a diaphragm:
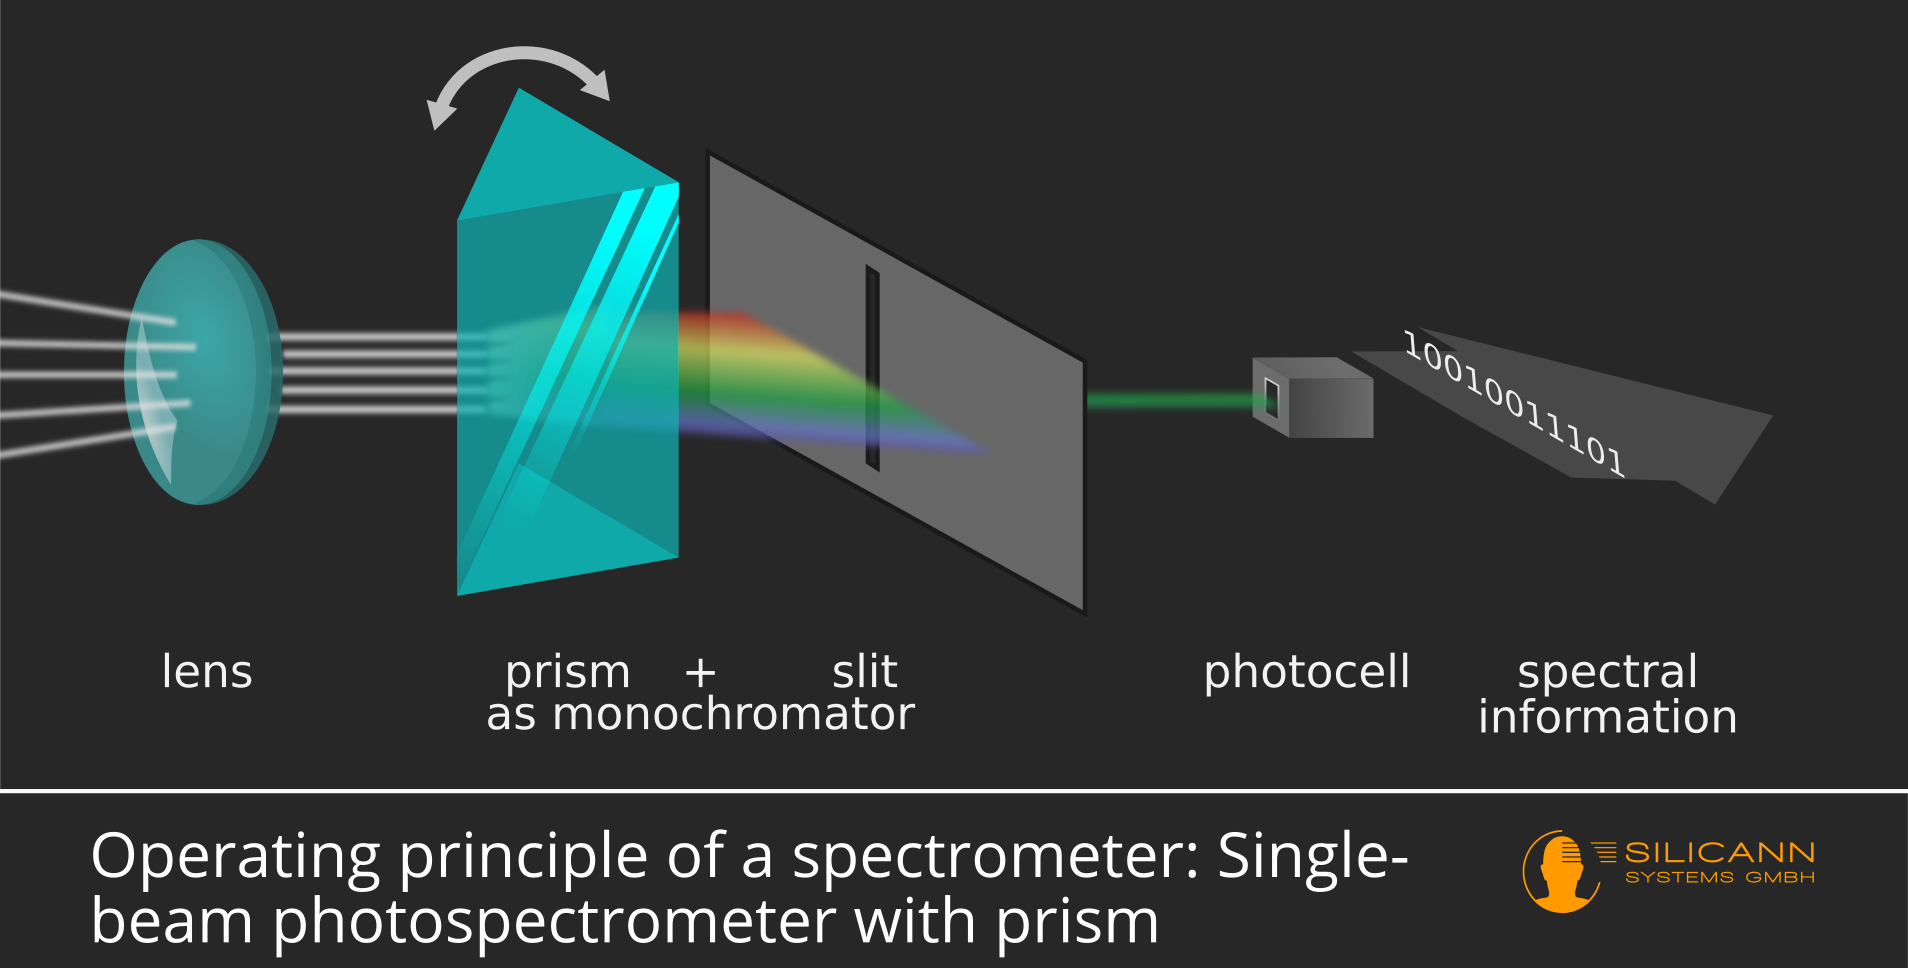
This design has the advantage that very high resolutions can be achieved in this way, i.e. the measured spectrum can be separated into many small subsets. On the other hand, diode array spectrometers can achieve significantly higher measurement speeds and are less susceptible to vibrations because they do not contain any moving components. Classically constructed devices are therefore mainly found in laboratories, while the more robust diode array spectrometers are usually used in industrial applications.
Please note: spectrometer can refer to both an electrical component and the finished device. These illustrations only describe how the component works.
However, the analog signals coming out of it still have to be converted into digital information in order to be able to calculate with them. And a spectrometer as a device should also be used, i.e. users must be able to make and save settings, filter spectra and read out final results via the spectrometer outputs.
In the case of inline or process spectrometers, there are very often additional switching outputs that can be used to take over control functions in running processes, for example to automatically detect and sort out the respective object when an error is detected in production. To do this, spectra on the device must be taught in beforehand and provided with certain tolerance ranges in order to automatically distinguish between acceptable results and production errors later on in production.
What is a process spectrometer?
Many spectrometers on the market are designed for use in laboratories and similar environments. There, a person sits at a table with the test object and more or less manually reads the spectral result that is output by the spectrometer. The measurement result is usually already available in digital form and may be transferred to a computer via USB or other interfaces. It can then be further analyzed there. With laboratory spectrometers, the transfer and further processing step can also be partially automated as soon as the measurement result has arrived in the computer. In most cases, however, the process as a whole remains largely manual: a person manually adds a new test object to the spectrometer and then removes it again.
This is rarely possible in automated production technology. Economic efficiency simply requires process speeds that are too high. For this reason, both the detection and the resulting action should be automatic: The sensor and actuator work together to form a control loop.
Process spectrometers are spectrometers that can be used in this form in production. Such spectrometers usually have their own programmable switching outputs that are connected to the actuators. Process spectrometers therefore not only record the specific spectrum, but also control the actuators connected to them according to previously configured rules. If the measured test object does not fall within the defined tolerance range, it is automatically sorted out or assigned to a different quality class.
Process spectrometers practically always have to achieve higher sampling rates. With laboratory devices, one measurement per second is often sufficient, whereas inline spectrometers often sample in the kilohertz range, i.e. they measure and process thousands of impressions per second and switch the outputs just as quickly.
Spectrometers beyond visible light
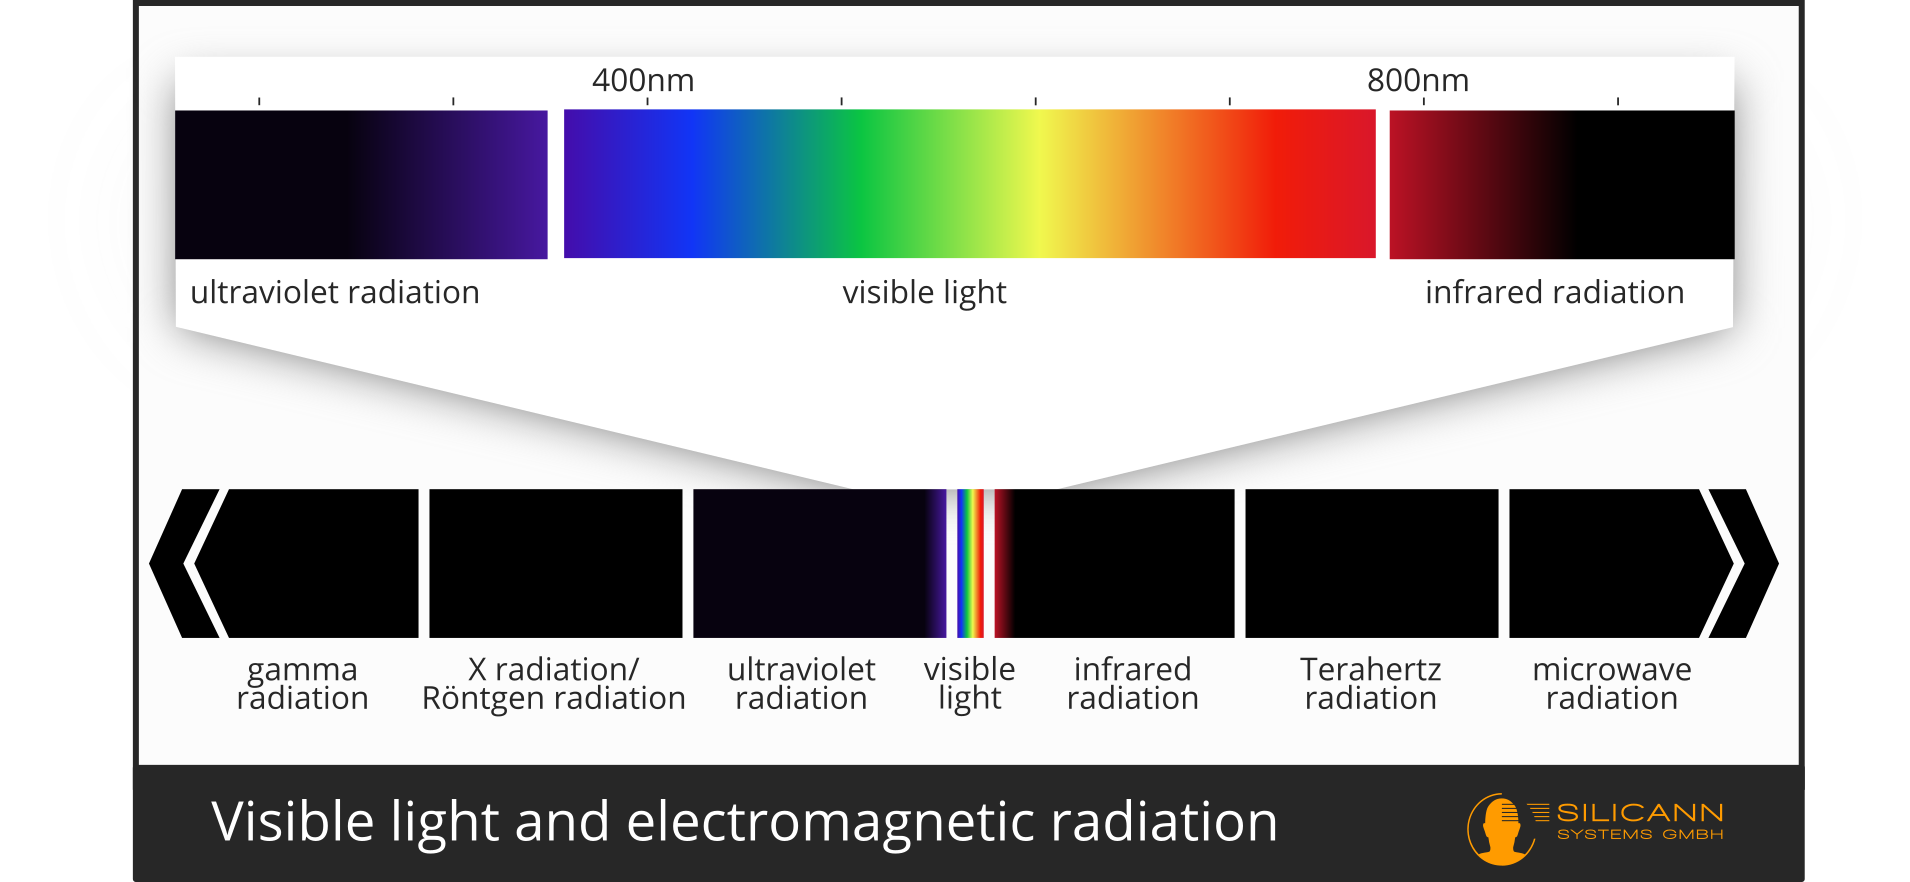
The interactions of radiation and matter also take place beyond visible light. Visible light is simply the range of electromagnetic radiation that we can perceive with our eyes. Visible light stands out for one simple reason: it is the wavelength range in which our star, the sun, emits the most intense radiation. This is why our eyes have evolved to detect precisely this wavelength range. Beyond the visible wavelengths, there are no fundamental differences to other areas of electromagnetic radiation. The adjacent regions of electromagnetic radiation are of particular interest for spectrometry: the shorter-wave UV radiation and the longer-wave near-infrared radiation.
UV and infrared radiation are of course no longer relevant for color measurement. However, what makes them so exciting for spectrometry is the large number of absorption bands that can be found in these wavelength ranges. In the UV range, it is mainly electron transitions that can be observed, while in the NIR range it is primarily vibrational excitations of molecules that take place.
UV spectrometers: Precise determination in the laboratory
UV spectroscopy is particularly suitable when the materials to be analyzed have electron transitions in the wavelength range between 200 and 400 nm. These transitions can be seen in the spectrum as relatively clearly defined peaks and can therefore also be easily analyzed mathematically. Alternatively, the analysis of unsaturated organic compounds is a common application for UV spectroscopy. UV spectrometers are usually found in laboratory environments or handheld devices for individual measurements. Although there are also process spectrometers for continuous measurements in industry, they are currently only found in a few niches in which the special features such as the low penetration depth of UV radiation or the frequent need for sample preparation are not a limitation. However, if UV spectrometers can be used, they can be used for both qualitative measurements (i.e. determining the substance from which a sample is made) and quantitative measurements (i.e. determining the percentage of one or more substances in a sample).
NIR spectrometers: Quantitative analysis in the process
Near infrared radiation, the longer wavelength range beyond visible light with wavelengths between 800 nm and 2500 nm, is used in many fields for process spectrometry. The near infrared has a number of favorable properties. An important example of this is the fact that NIR radiation generally penetrates deeper into the material. As a result, samples need to be prepared less or not at all in order to obtain usable information: An NIR spectrometer can be aimed directly at the passing goods in the process. In addition, many interesting molecular vibrations can be found in the NIR range, e.g. water (for determining the moisture content of a sample), proteins and fats. This is one of the reasons why spectroscopic measurements of foodstuffs, for example, are established procedures. This applies to fresh foods such as fruit, vegetables, milk or vegetable oils, as well as processed products such as baked goods, cold cuts, etc. Because nitrogen can also be easily detected in the NIR range, the nitrogen content of leaves is already being measured automatically in some agricultural applications in order to fertilize only as much as is really necessary.
Both moisture and nitrogen content are also important parameters in the wood-processing industry, and NIR spectrometers are also frequently found there.
However, the fact that so many oscillations are found in the near infrared is not only a blessing, but also a curse. In contrast to the narrower and more clearly assignable peaks caused by electron transitions, the molecular vibrations are usually broader - and often overlap with each other. Quantitative testing, i.e. determining the quantity of one or more substances in a sample, is therefore still possible, but mathematically somewhat more complex.
The individual components cannot be read directly from the complex spectra. However, the information is still contained in the spectrum, but the pattern that marks the proportion of a particular component in the sample must first be worked out. To do this, a series of samples is always measured once with the spectrometer and once with an established method. The established method can range from classic wet chemistry to the use of already calibrated spectrometers. It is also possible to produce samples with very specific compositions especially for the series of measurements. If, for example, the proportion of real olive oil in a vegetable oil sample is to be determined, then samples could be mixed together in such a way that they contain olive oil content in stages from 0 % to 100 %. The spectra are then recorded from this series of samples.
If this list of spectra is available together with the known sample compositions, various algorithms can be used to work out the patterns from the spectra that predict the respective contents. The classics Principal Component Regression (PCR) and Partial Least Squares Regression (PLS) are established for this quantitative analysis. Recently, AI models have also been increasingly used.
NIR spectroscopy is an established method in many industries, which also works robustly in harsher process environments in various industries - if the components which are to be determined in the respective process have vibrations that are found in the near-infrared.