Milestones in the History of Spectroscopy
What is spectroscopy
Spectroscopes and spectrometers allow us to learn far more about objects than what is possible with the naked eye alone.
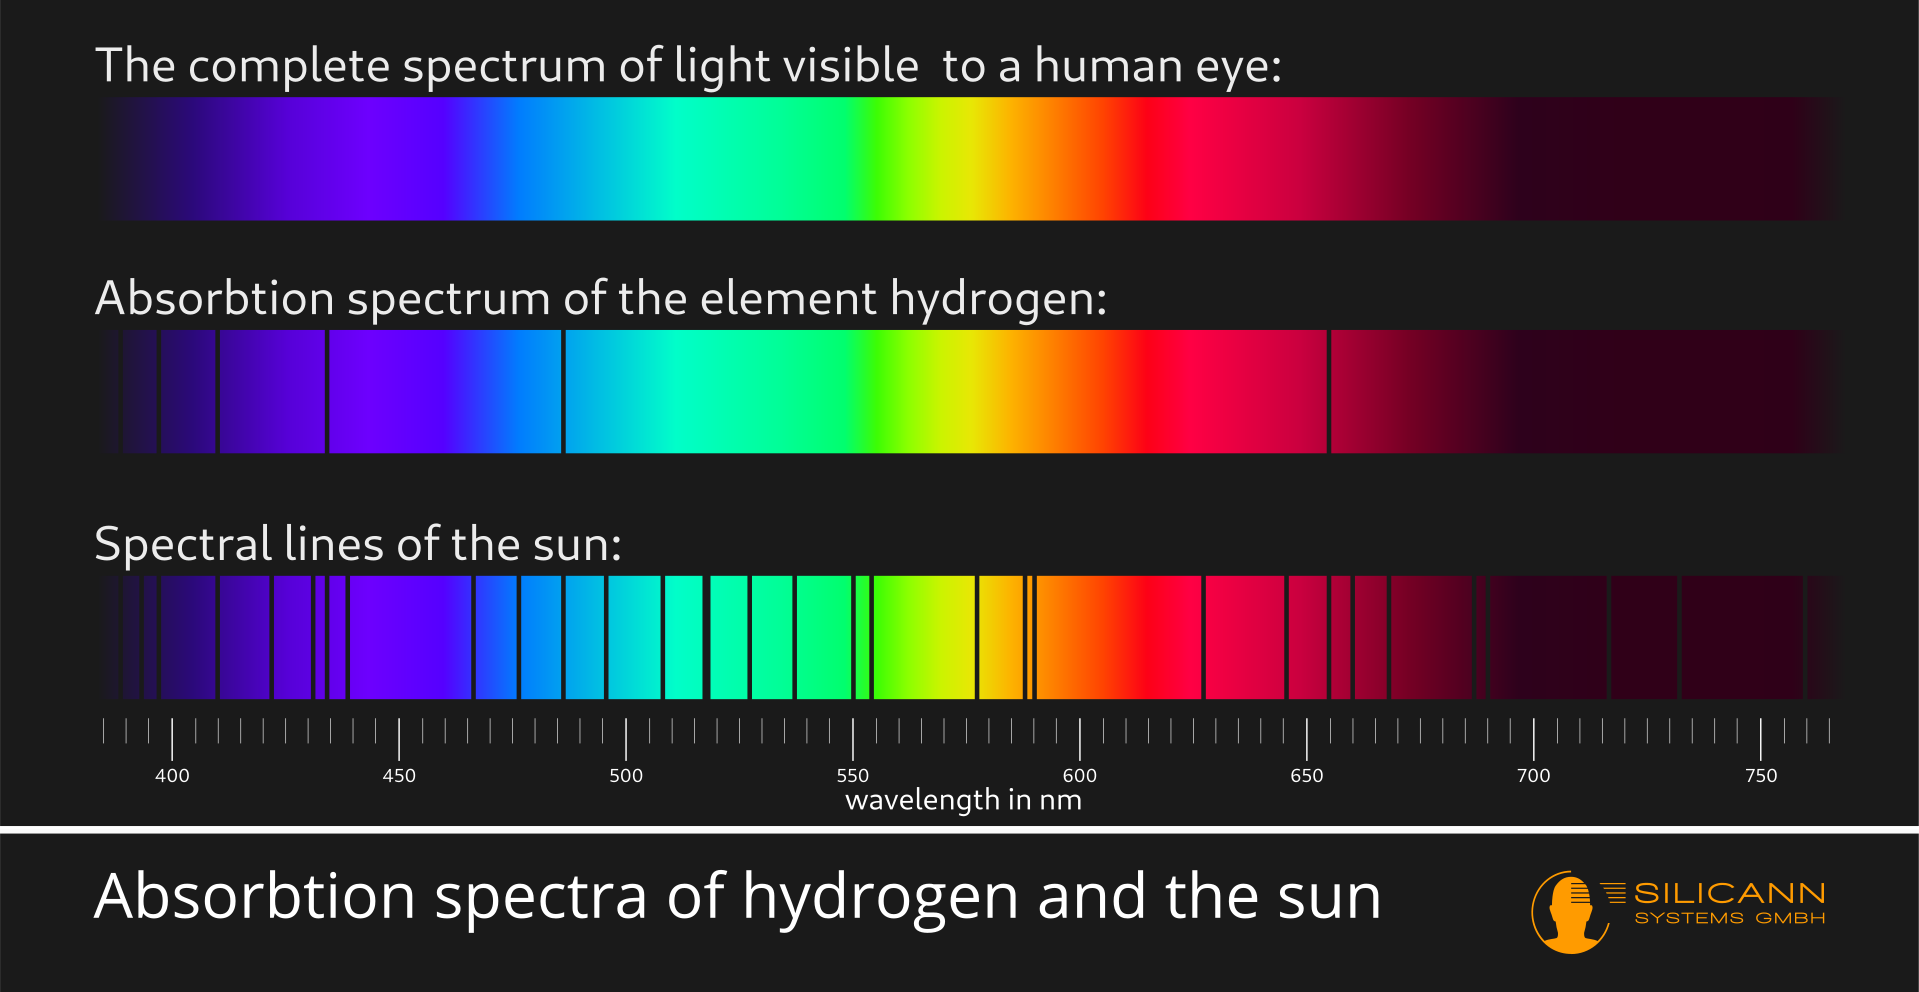
Visible light is electromagnetic radiation with wavelengths between approx. 400 nm and 780 nm. In the light of the sun, for example, all of these wavelengths occur (and even more in the non-visible range), albeit with different intensities. Normally the sunlight is perceived as white. If you fan out the sunlight according to wavelength, e.g. by using a prism, then the rainbow colors of the spectrum become visible. The rays themselves have not changed, i.e. the colors were actually already there. Splitting them up with a prism just made it possible for us to individually perceive them.
If substances are exposed to sunlight some of the components of the substance will react with some of these wavelengths. The beams encounter certain molecules, for example, which can be made to oscillate more strongly with exactly this wavelength. Those parts of the light beam are then not emitted again by the material, but the rest is - otherwise this material would appear absolutely black to us.
This basically happens with all substances, but not always only in visible light. All substances absorb some part of the spectrum. The specific parts differ from material to material.
This is exactly what spectroscopy uses: if we fan out the light from a light source into its spectrum and look very closely, then very specific narrow lines will practically always be missing. These narrow lines are the wavelength ranges at which components of the light source have absorbed the electromagnetic radiation. The lines therefore give us information about the nature of a light source. Based on these lines, candlelight, the light of a neon tube and also sunlight can be clearly distinguished from each other, for example, although the light impression for our human eyes is identical. This method has been known for more than 200 years, and spectroscopes are still used today, e.g. in astronomy, to learn more about the structure of stars.
Spectrometry gives us additional information because spectrometers not only return a yes or no, spectral color or black line, for each wavelength segment, but also return more precise information on the radiation intensity.
We owe the fact that we can use such instruments today to centuries of intensive research into the nature of light. The following sections highlight some important milestones on the way to what we know today.
From when exactly an instrument for the detailed analysis of light can be regarded as a spectroscope is ultimately an arbitrary definition. For example, we know from texts by Seneca and Pliny that ancient Rome already knew that prisms could be used to create rainbow effects. Here it is assumed that an actual spectroscope should be a device, designed on purpose, with the help of which light from a specific light source (or light reflected from a specific substance) is to be examined spectrally, i.e. fanned out into its individual wavelength components.
Snellius and the law of refraction
Willebrord Snellius (born Willebrord Snel van Royen) was a Dutch mathematician who lived from 1580 to 1626. Snellius did a lot with trigonometry. One of his notable achievements was the fairly accurate calculation of the Earth's circumference, which deviated by less than 4% from the actual circumference known today. He achieved this feat by measuring the angles between himself and high points, such as church towers, from different positions. After making a specially designed measuring instrument and taking complex measurements at many different points, he succeeded in deriving the radius of the earth. As is so often the case, the basic idea oftrigonometry had been known for a long time (e.g. in Greek antiquity and in the early medieval Arabic region), and Snellius' achievement lay in the mathematical precision of his work.
His work on optics is more interesting for the history of spectroscopy. He was unable to publish the complete work before his death. However, versions seemed to be circulating among contemporary experts, including Christiaan Huygens (see below) who seem to have read them at the time. Only a short version of the manuscript has survived - but its content is sufficient to secure Snellius a position in the history of optics.
Snellius begins his book with a presentation of the then known international knowledge of optics. For example, the law of reflection or the law of reversibility of the light path was already known. It states that a ray of light striking a flat surface is reflected at the same angle at which it struck the surface. Accordingly, the light beam could also shine in the opposite direction and would still follow an identical path.
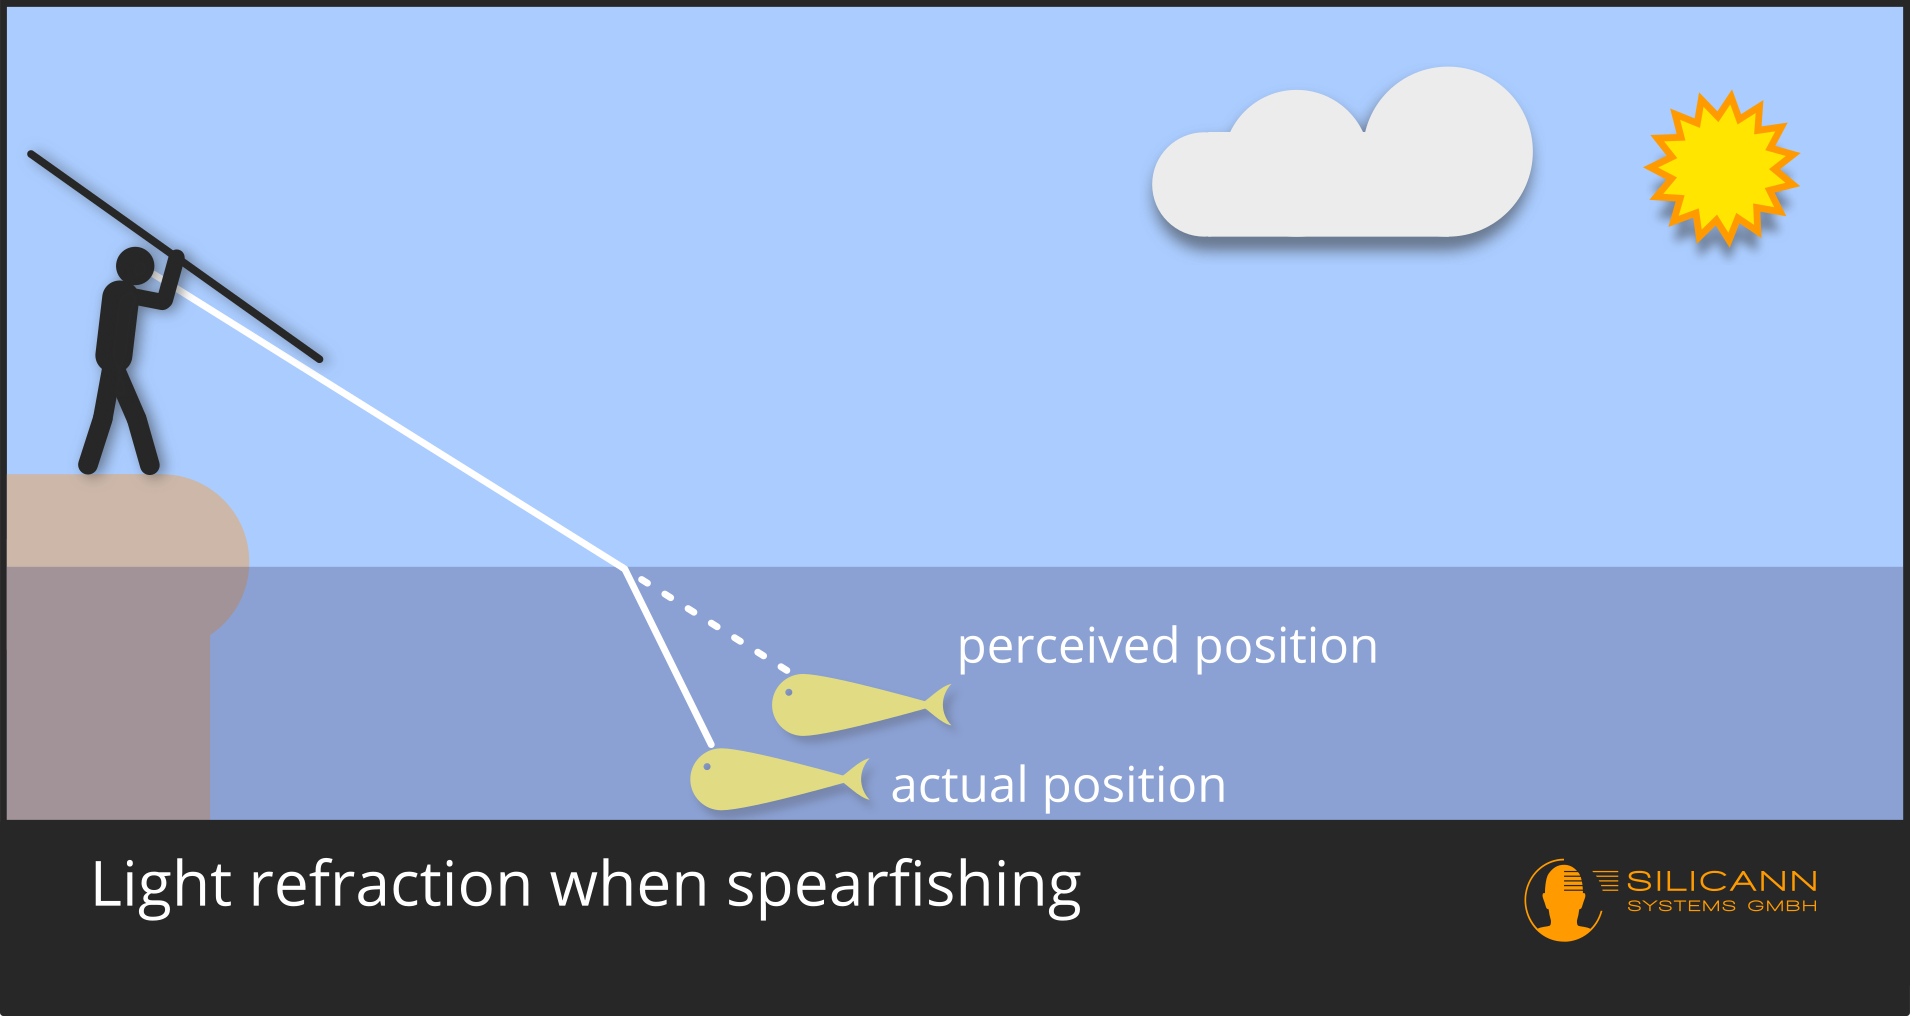
After describing the known, Snellius derived his own innovation: the law of refraction. Thousands of years ago, our ancestors knew that light rays change their angle when entering a denser medium: if you don't develop an intuitive concept for this through practice, you will never be successful at spearfishing.
However, it was only with Snellius that the phenomenon could be clearly described mathematically and thus be predictable. Previously, there were tables of refraction angles for different materials prepared by others through systematic observation. However, Willebrord Snellius had managed to define a general formula for predicting the new angle, which only depended on the entrance angle and the relative density difference of the materials. Nowadays, this relative density difference between two materials is no longer used, but only the refractive index of a single material. Except for this detail, however, Snellius' work still corresponds to our current understanding, if we ignore quantum physics for a moment.
The law of refraction can also be used to predict the size of the entrance angle from which a ray no longer penetrates the material but is instead reflected from the surface.
The formulation of the law of refraction was important for the further development of optical instruments and elements such as lenses: It was now possible, to derive precise refractive indices for e.g. different types of glass from empirical observation of the optical paths as a first step. Knowing the indices of refraction, in turn, made it possible to accurately predict the paths that light will take through a lens before the lens was even made.
Newton's spectral colors
In Isaac Newton's time one of the open questions in optics was that of the nature of color: are colors a property emanating from objects, or does color arise from light? And if color arises from light, why do we see completely different colors depending on the object, despite them being illuminated by the same light?
We owe answers to this question to a humanitarian tragedy and to Newton's prosperous position: in 1665 and 1666 a plague epidemic raged in England and especially in London. The plague had been endemic to the region for decades, but a spike in cases prompted the university to temporarily close in 1665. Unlike most of the populace, Newton was apparently fortunate to have enough financial means to spend those years in seclusion in rural exile.
There Newton spent his time anything but idle: In systematic experiments he dealt with the splitting of sunlight into its spectral components: A ray of light reaches a prism through a small hole in the window shutter. The result was the phenomenon of rainbow colors, which had been known for a long time, instead of a spot of light on the screen at the other end of the experimental setup. Among other things, Newton tried to fathom the strange shape of the resulting colorful spot: If the beam was first passed through a prism, the shape of the spot was always roughly rectangular in all experimental variants, instead of being just as round as the hole in the window.
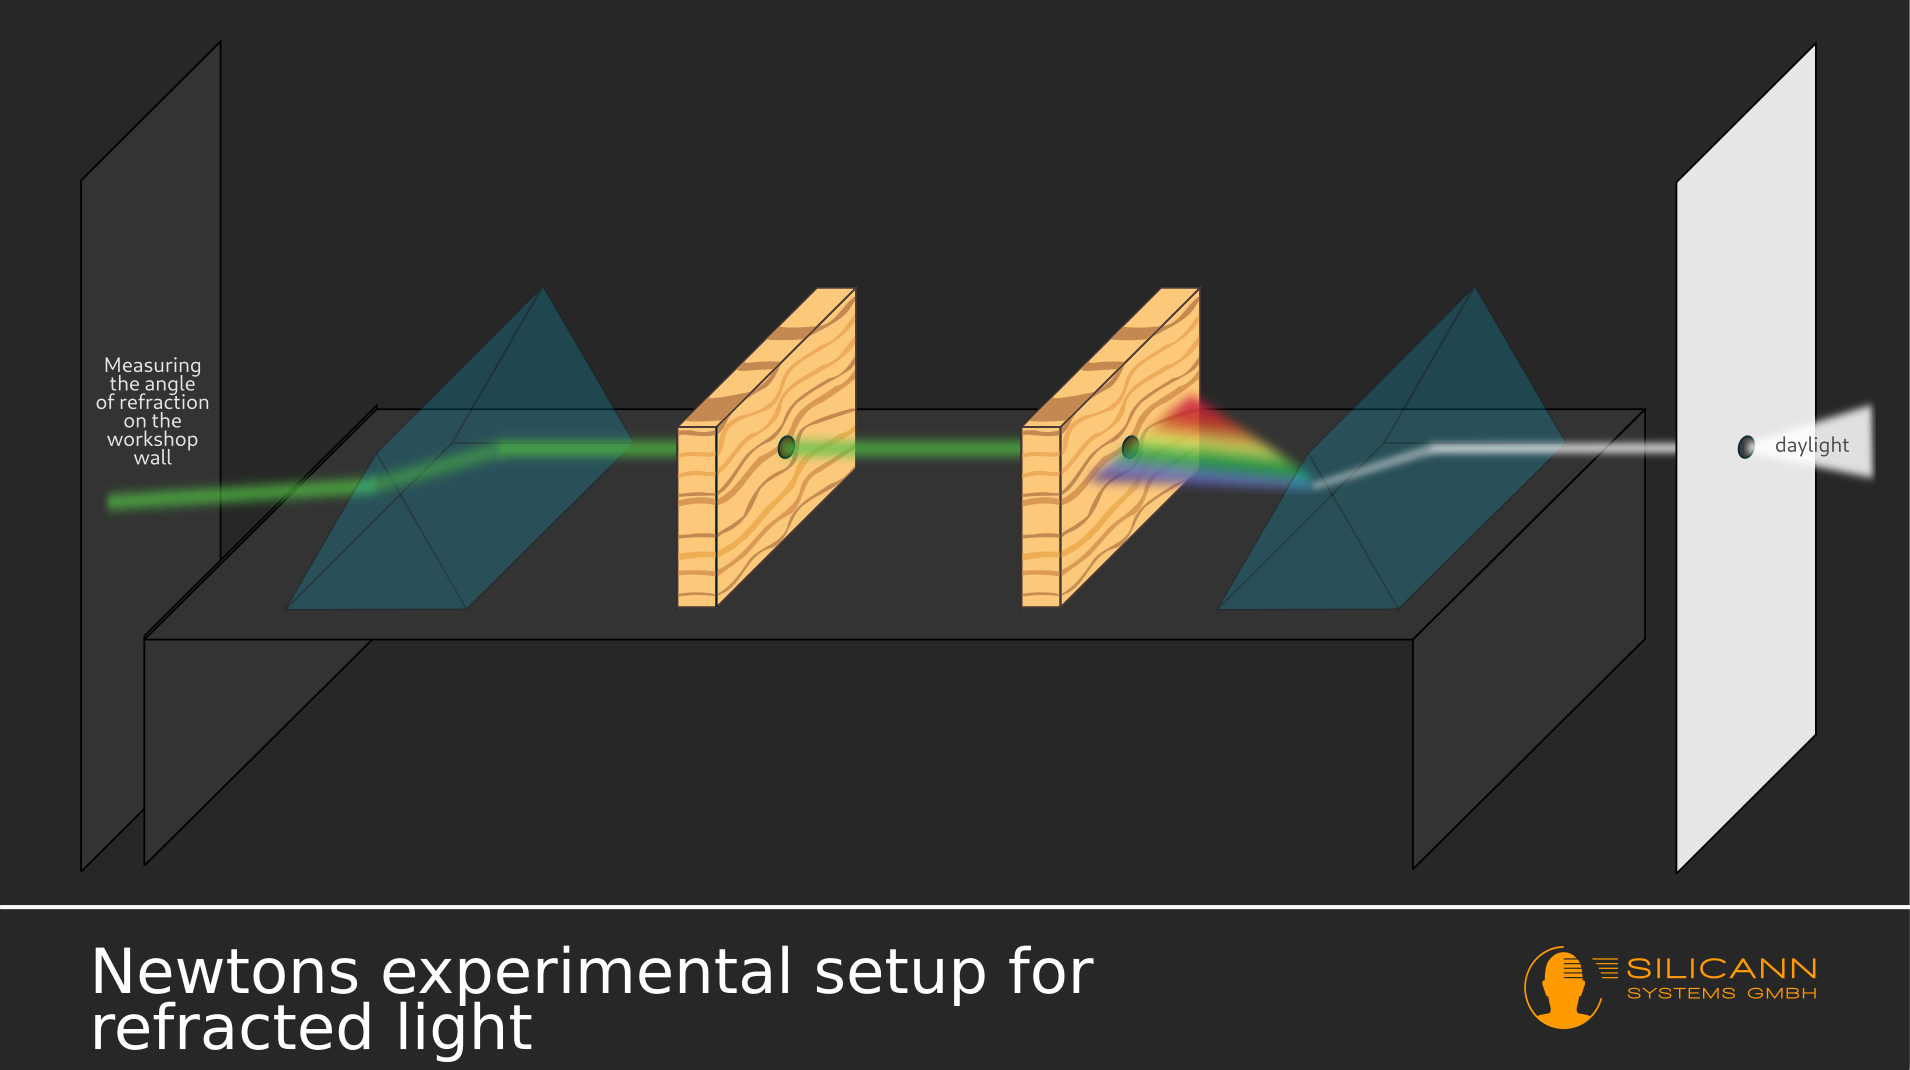
Based on his observations, Newton came to the conclusion that the colorful rays in the rainbow colors must have been there beforehand - because the separation of the white ray into the rainbow colors could be reversed if, after the first prism, a second one was placed at exactly the right angle in the path of the rays was laid. Any colored light can therefore be produced by deliberately separating and connecting the individual spectral components.
In addition, this was only possible because the light is refracted at a certain angle according to a known pattern on its way from the air through the prism, i.e. a transition between substances of different densities. However, this angle does not depend exclusively on the material, as previously assumed, but apparently also on the color of the light, as Newton recorded in his writings. There was a pattern: the closer the color was to the deep blue end of the rainbow, the wider the angle appeared. This finally explained the rectangular shape of the light spot: Due to the increasing angle of refraction depending on the spectral color, the light spot that appeared behind the prism also widened.
Since the perceived color of such light always corresponds to a specific wavelength, this idea is very close to our current understanding.
Newton even discovered that certain colors could be mixed together to create a color impression that wasn't originally part of the light. And the exciting thing: Under this ligh, objects appear to have a different color than when irradiated with the unmixed light of the same color. This led Newton to surmise that color is not a property of an object at all, but is essentially determined by the light that shines on the object.

With these findings another color phenomenon, which has already been examined in detail here elsewhere, could now be explained: metamerism.
The experimental setup used there can, loosely defined, already be regarded as a spectroscope: Newton specifically fanned out the light spectrally in order to examine its components. However, it was not a finished instrument that could be used to carry out investigations in a simple and reproducible manner.
Newton was a convinced proponent of the particle theory of light, and apparently made no observations in his experiments (or at least documented them in writing) that would contradict this. Newton called the light particles "corpuscles".
With the variant of a reflecting telescope known today as the Newton telescope, Isaac Newton also advanced optics in a very practical way. A major optical error of the then common telescope forms, such as the Galileo telescope, was the so-called chromatic aberration. Here the edges of an imaged object blur into different colors. Newton explained this problem as a practical example of his observation of wavelength-dependent refraction in a prism. He then designed his variant of the reflecting telescope and also made the optical elements himself. In fact, as predicted, Newton's telescope did not have the mentioned error. However, it was not very bright and introduced a new optical error, so that only further developments by other physicists made the basic concept competitive in later decades.
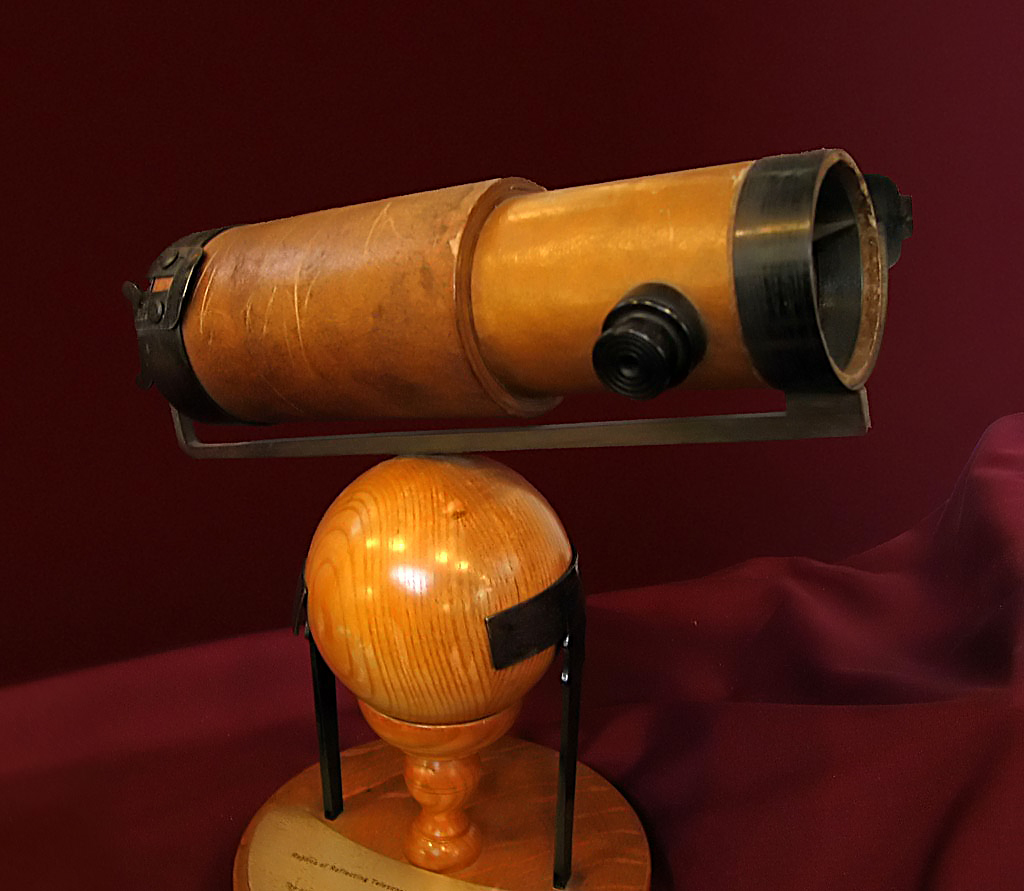
Replica of Newton's 6" telescope, Photo by Andrew Dunn, CC BY-SA 2.0
Huygen's principle
The Dutch researcher Christiaan Huygens saw things differently. In the then quite active debate between proponents of the wave theory and the particle nature of light, Huygens was clearly aligned with the wave fraction.
What spoke in favor of the wave model of light, for Huygen, was that it could explain effects such as diffraction, refraction and interference well. In his understanding, light is not itself made up of particles, but represents a force that causes the particles in a medium to collide, which in turn then touch other particles, so that this disturbance spreads out in waves - just like a stone exerts force on the water particles, which transfer this force to the neighboring particles until a water wave is created that is visible to us.
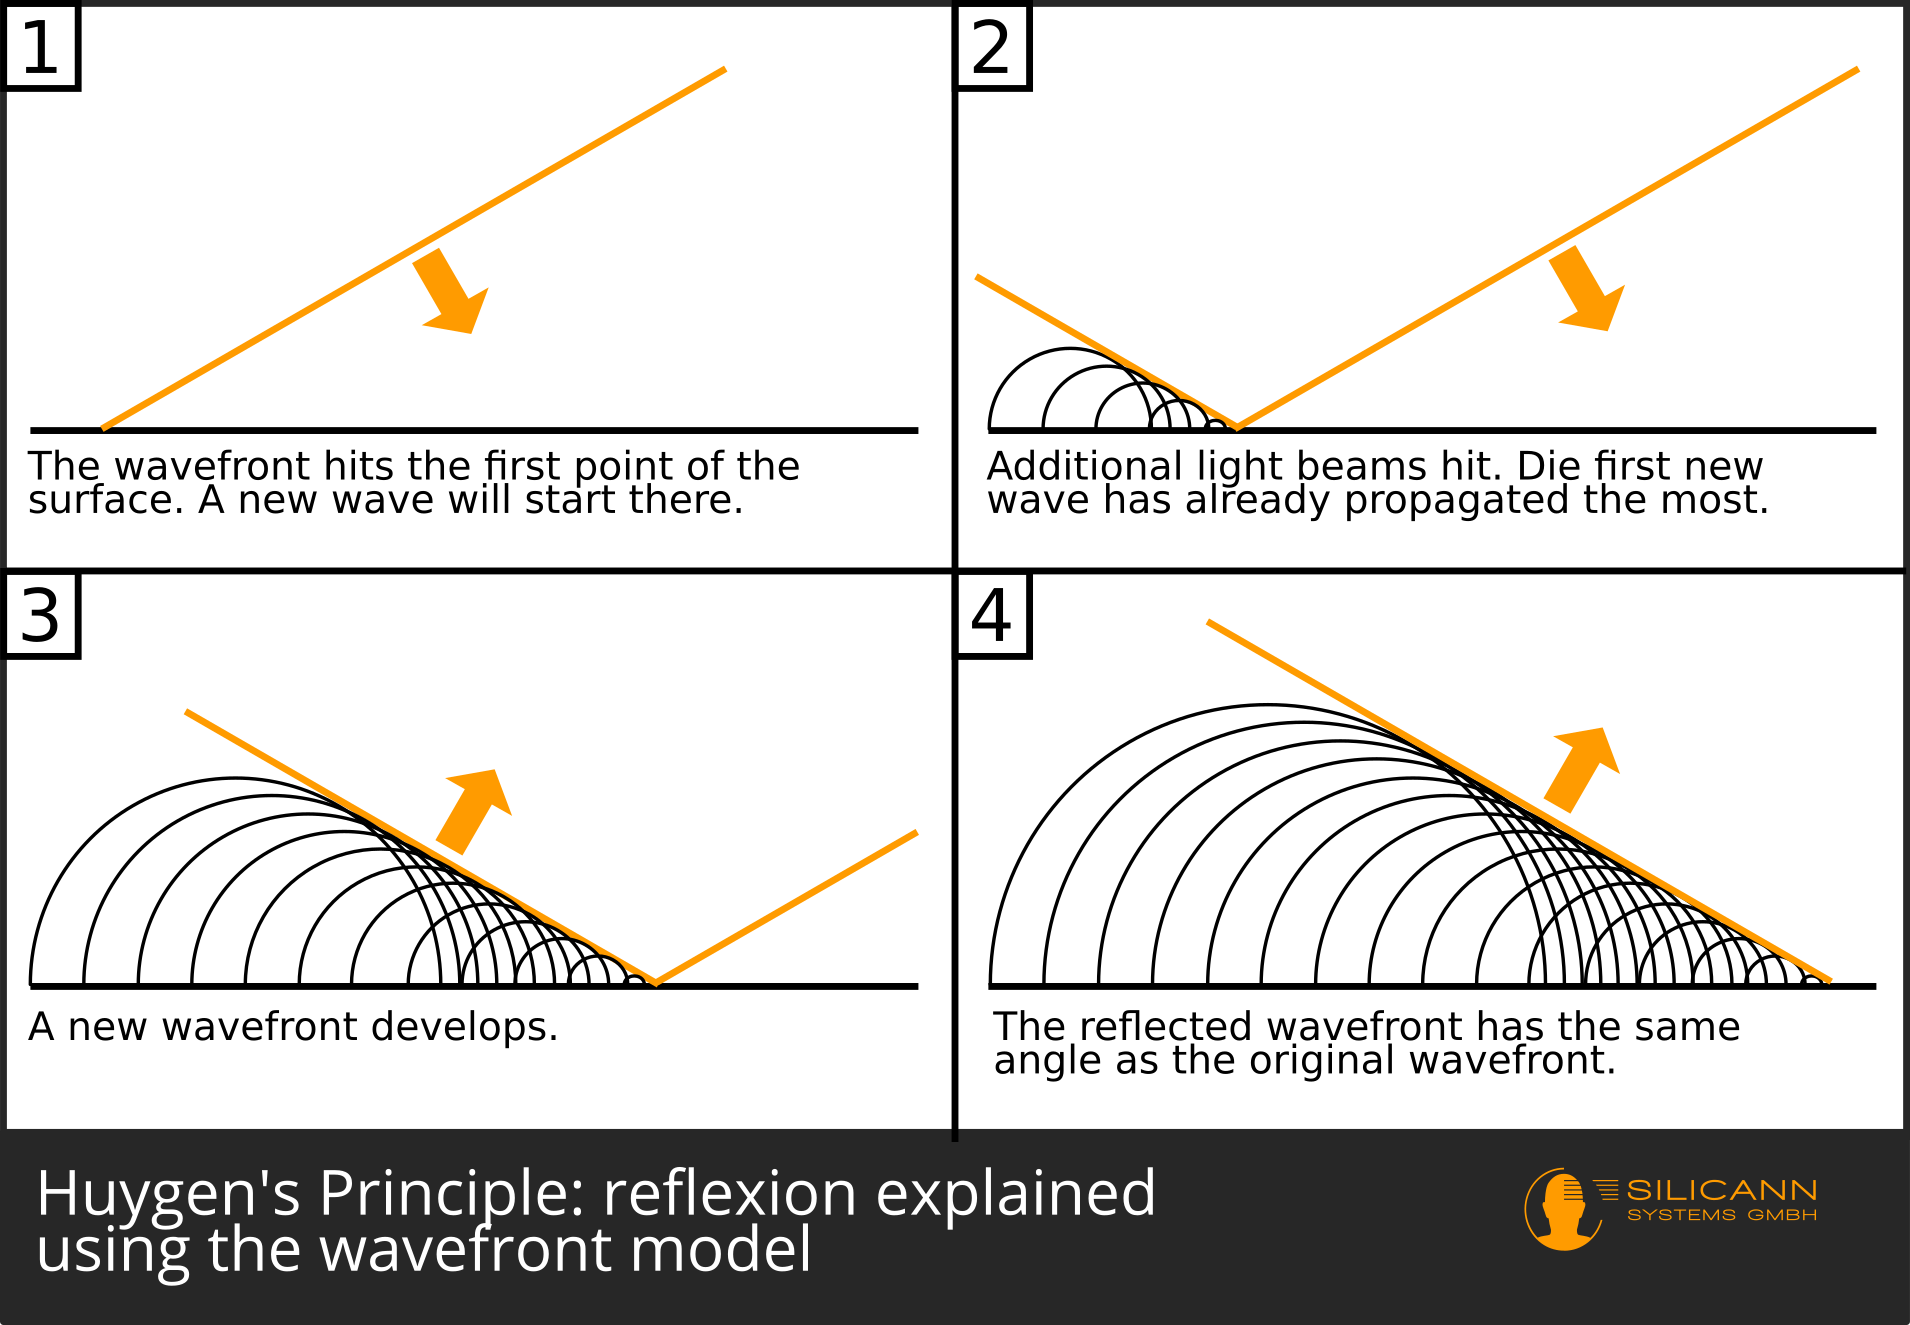
With this basic assumption, as Huygens showed in 1678, reflection and refraction could be explained purely geometrically. The basic approach to what is now called Huygens' principle: Light is thought of as a bundle of parallel rays. At any given point in the direction of travel of these light rays, one can imagine small waves propagating at the same speed. A line can be drawn across these arcs of waves, the so-called wavefront. It is always perpendicular to the direction of the light beam. Each point on this wavefront is in turn the starting point of new elementary waves, over which a wavefront can again be drawn, etc.
If such a wave front hits a surface exactly perpendicularly, every point of the wave front touches this surface at the same time. So if waves are drawn again from each point of contact, then the resulting wavefront is also exactly parallel to the wavefronts that have moved towards the surface. In other words, the light beam is reflected back in exactly the direction from which it came.
What happens now when the wavefront hits the surface at an angle? Then there are certain points on the front that touch the material first, so that new elementary waves are created there. Since all of these waves grow at the same speed, the waves that came up first will already have larger diameters - the new wavefront will also be skewed, but pointing in a different direction: A reflection took place on the surface.
Significantly later, namely in 1816, Augustin Fresnel then also explained diffraction at a slit on the basis of Huygens' principle. For this reason, this approach is now often referred to as the Huygens-Fresnel principle.
Huygen's main work on optics, Traité de la Lumière, appeared in 1690 and contained his fully formulated wave theory. At the time of publication, however, it was not able to assert itself against Newton's corpuscle theory, which he presented in his Opticks.
Like Newton, Huyens was also a very open-minded, practically working inventor, to whom we owe the pendulum clock and corresponding considerations on the mechanics of the pendulum, among other things. And just like Newton, Huygens himself manufactured optical lenses and used them to construct a new variant of the refractor telescope. The result was obviously of high quality, because Huygens was the first to report, for example, that Saturn has rings that orbit it but never touch it.
Thomas Young's double slit experiment
Thomas Young initially dealt intensively with the nature of vision as a theoretical ophthalmologist. His research into the eye's ability to focus on objects at different distances earned him membership of the Royal Society, which also included Isaac Newton.
His double-slit experiments were particularly relevant to the development of spectroscopy. The background was, again, the long debate on the nature of light: Does light now consist of small particles or is it made of waves? Incidentally, a well-known contemporary of Young's, the French scientist Pierre-Simon Laplace, also belonged to the particle fraction. At the time of Young's publications in 1803/4, particle theory was very widespread.
Young then conceived an investigation essential for the further course of the discourse: the double-slit experiment.
Here light from a light source shines onto a double slit. The gaps between the slits must be quite small, but larger than the wavelength of the light. The rays now bend at the slits and are caught on a screen well behind them so that the result can be observed.
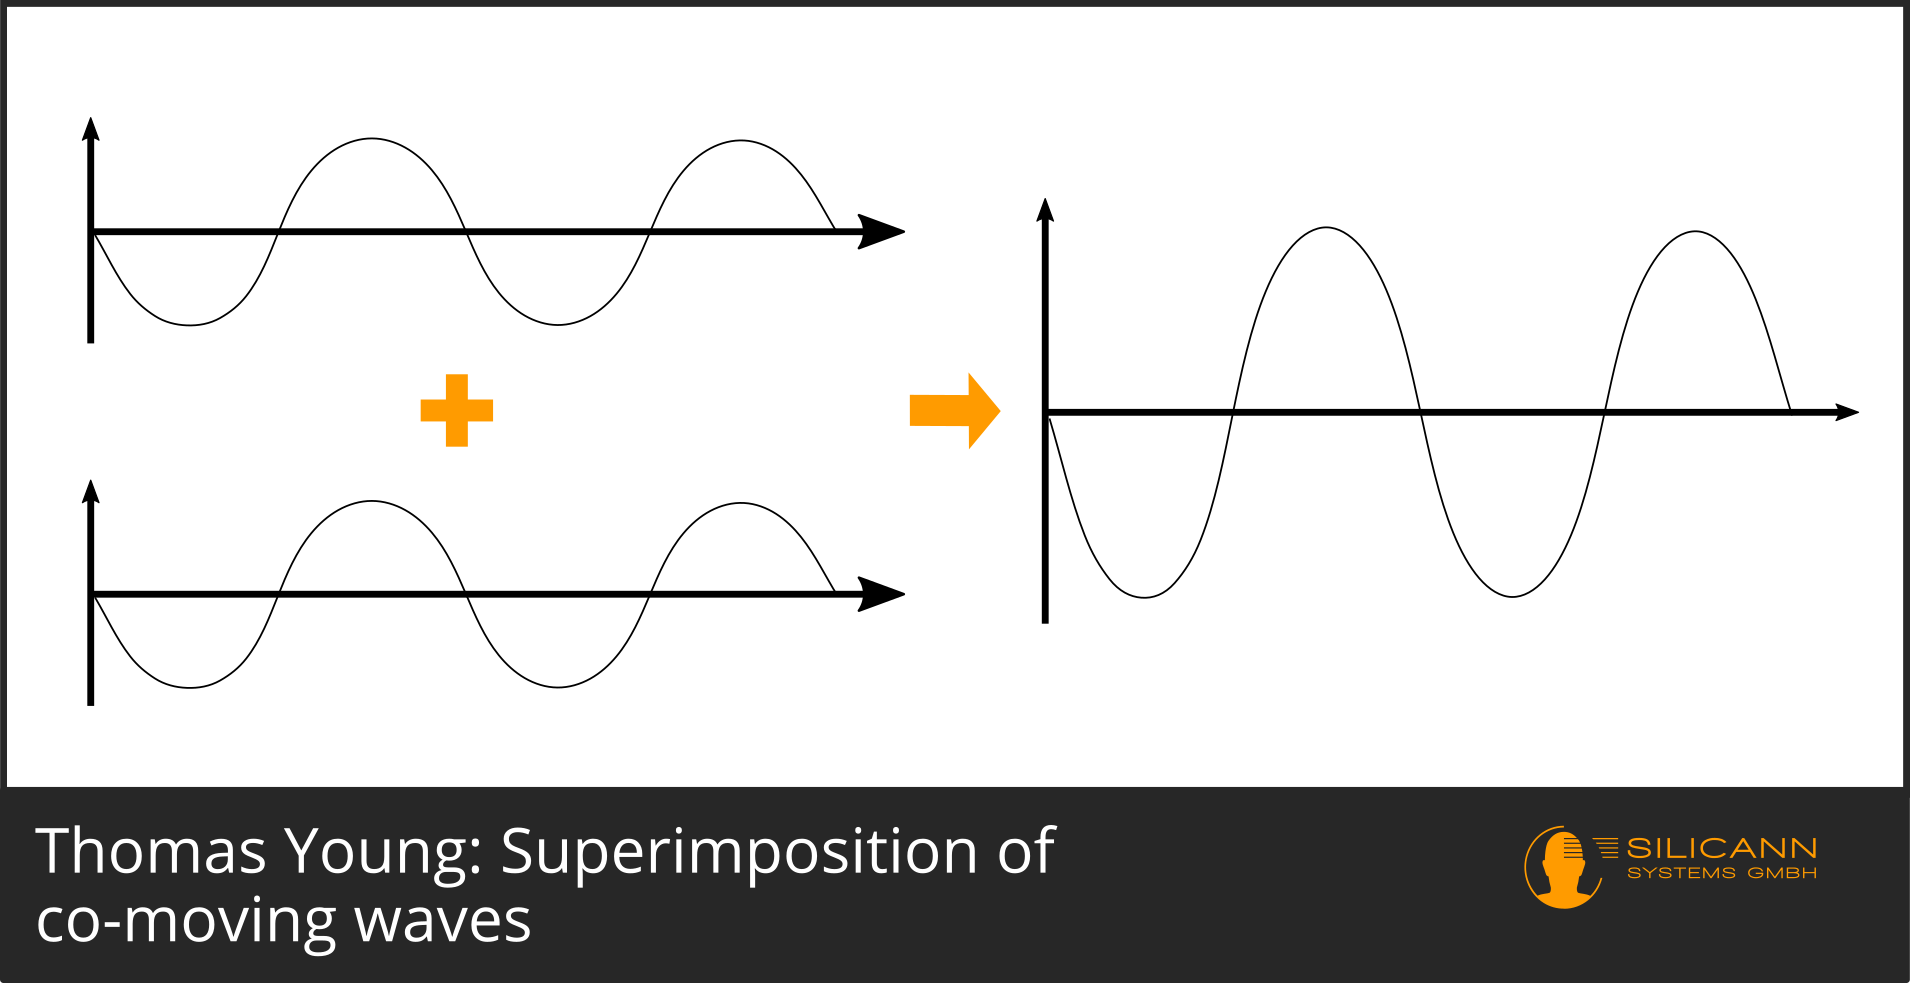
The individual rays can be thought of as ripples, just like ripples in a pond caused by a stone thrown into it. They oscillate evenly up and down, describing a sine curve.
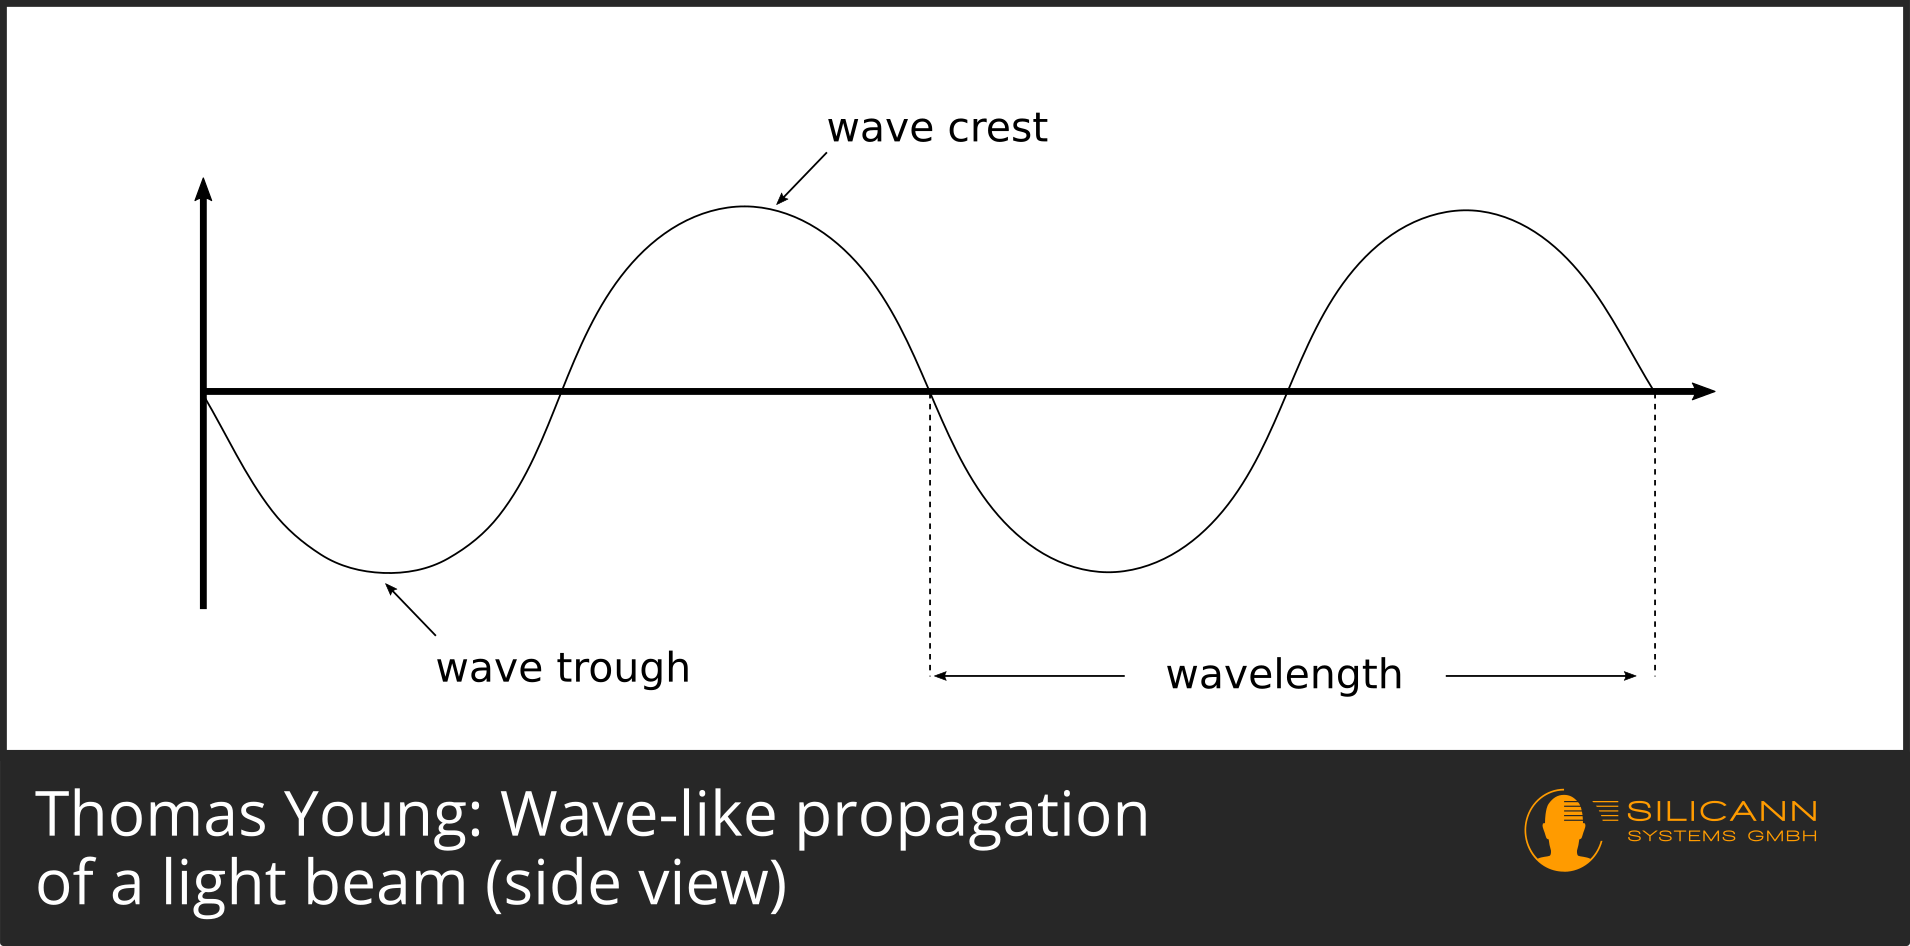
If we now imagine two beams, one of which is right at the top of the curve and the other is, too, the combined amplitude will be twice as large as before.
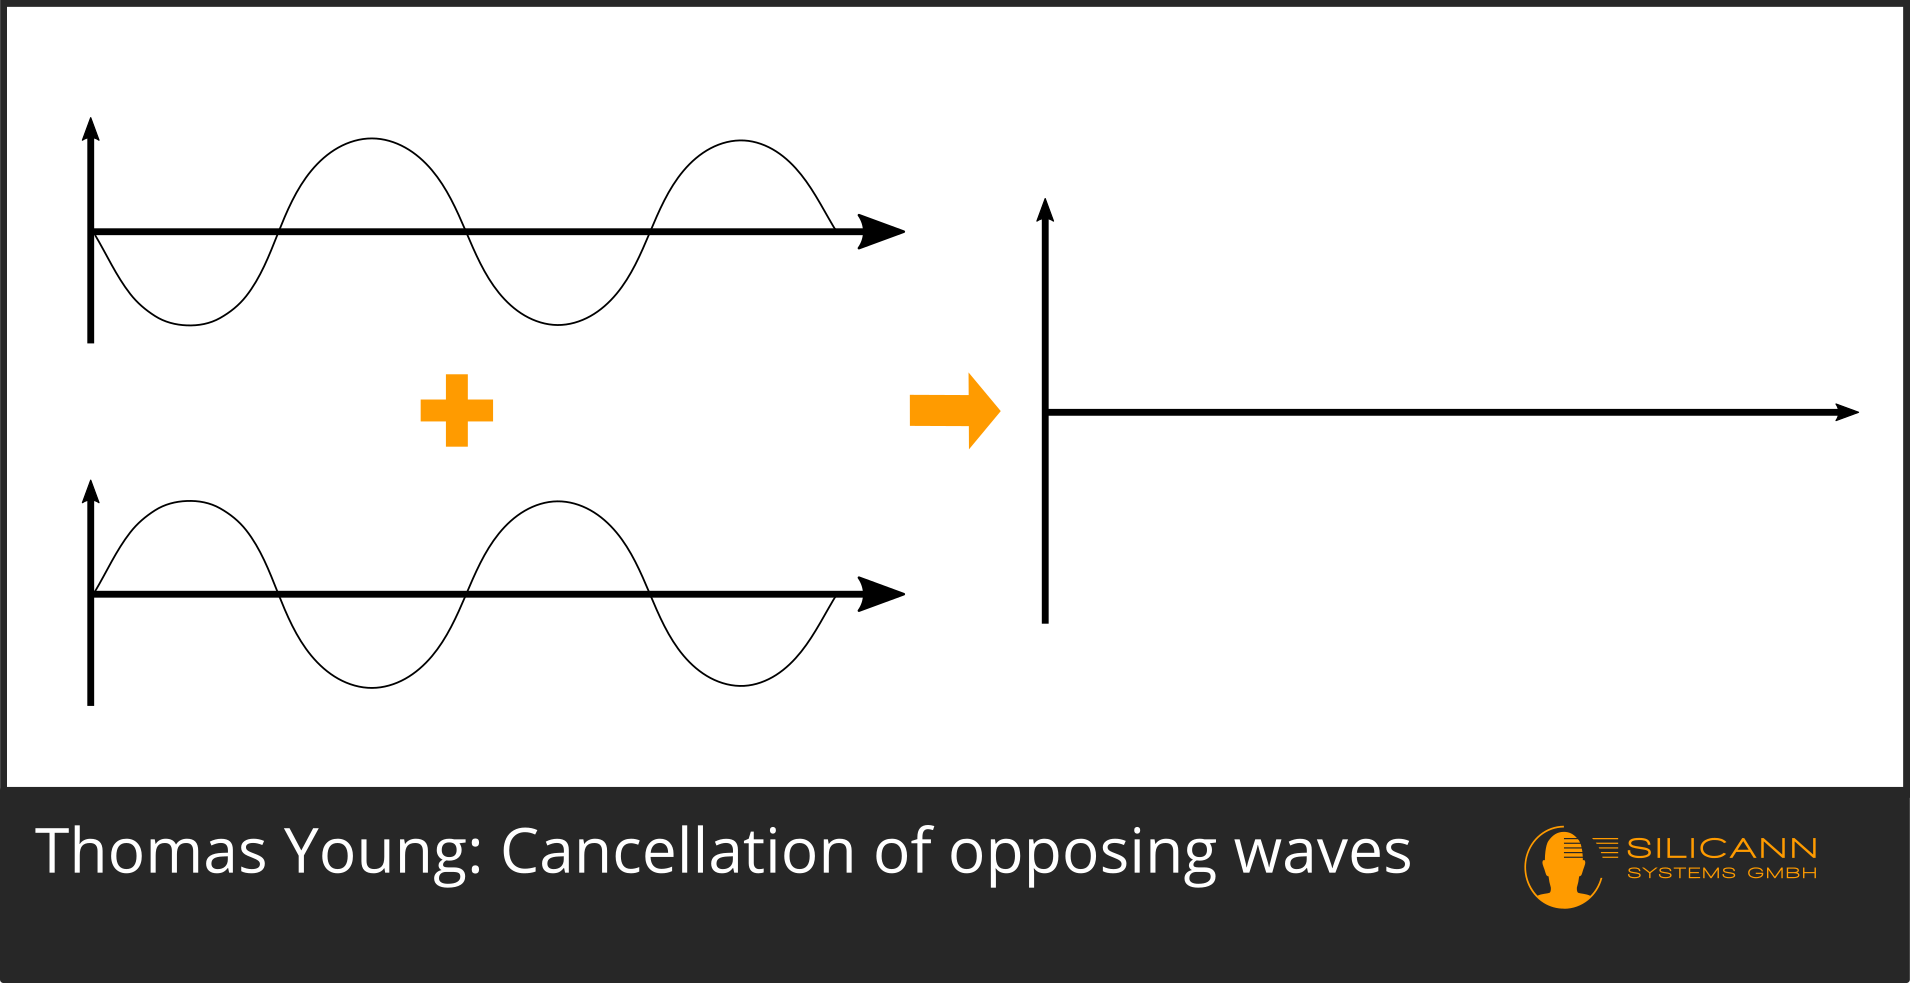
However, it can also happen that both rays meet in such a way that their respective curves are exactly opposite to each other: the first ray is at the highest point of its curve, the other ray at the lowest point. As a result, both positions add up to zero: an extinction takes place.
Whether this is just as clearly visible in the double-slit experiment depends on the light source used: ideally, it should only emit light with the same wavelength. Nowadays we can use a "simple" laser pointer for this, 200 years ago you could have fanned the sunlight with the help of a prism and only used a narrow part of the spectrum for the experiment. In both cases, however, exactly the effect described would have become visible on the wall: Clearly bright stripes alternate with practically completely dark spaces at regular intervals.
Of course, the double-slit experiment can also be carried out with multicolored light such as sunlight - in this case, however, the interference patterns would reveal themselves more through color shifts. The reason: the individual light rays have different colors and therefore also different wavelengths. Since diffraction is wavelength-dependent, amplification and extinction only take place partially.
Young visualized the phenomenon himself more than 200 years ago, but did not choose the side view of the wave, but a top view, in which only the wave crests were drawn:
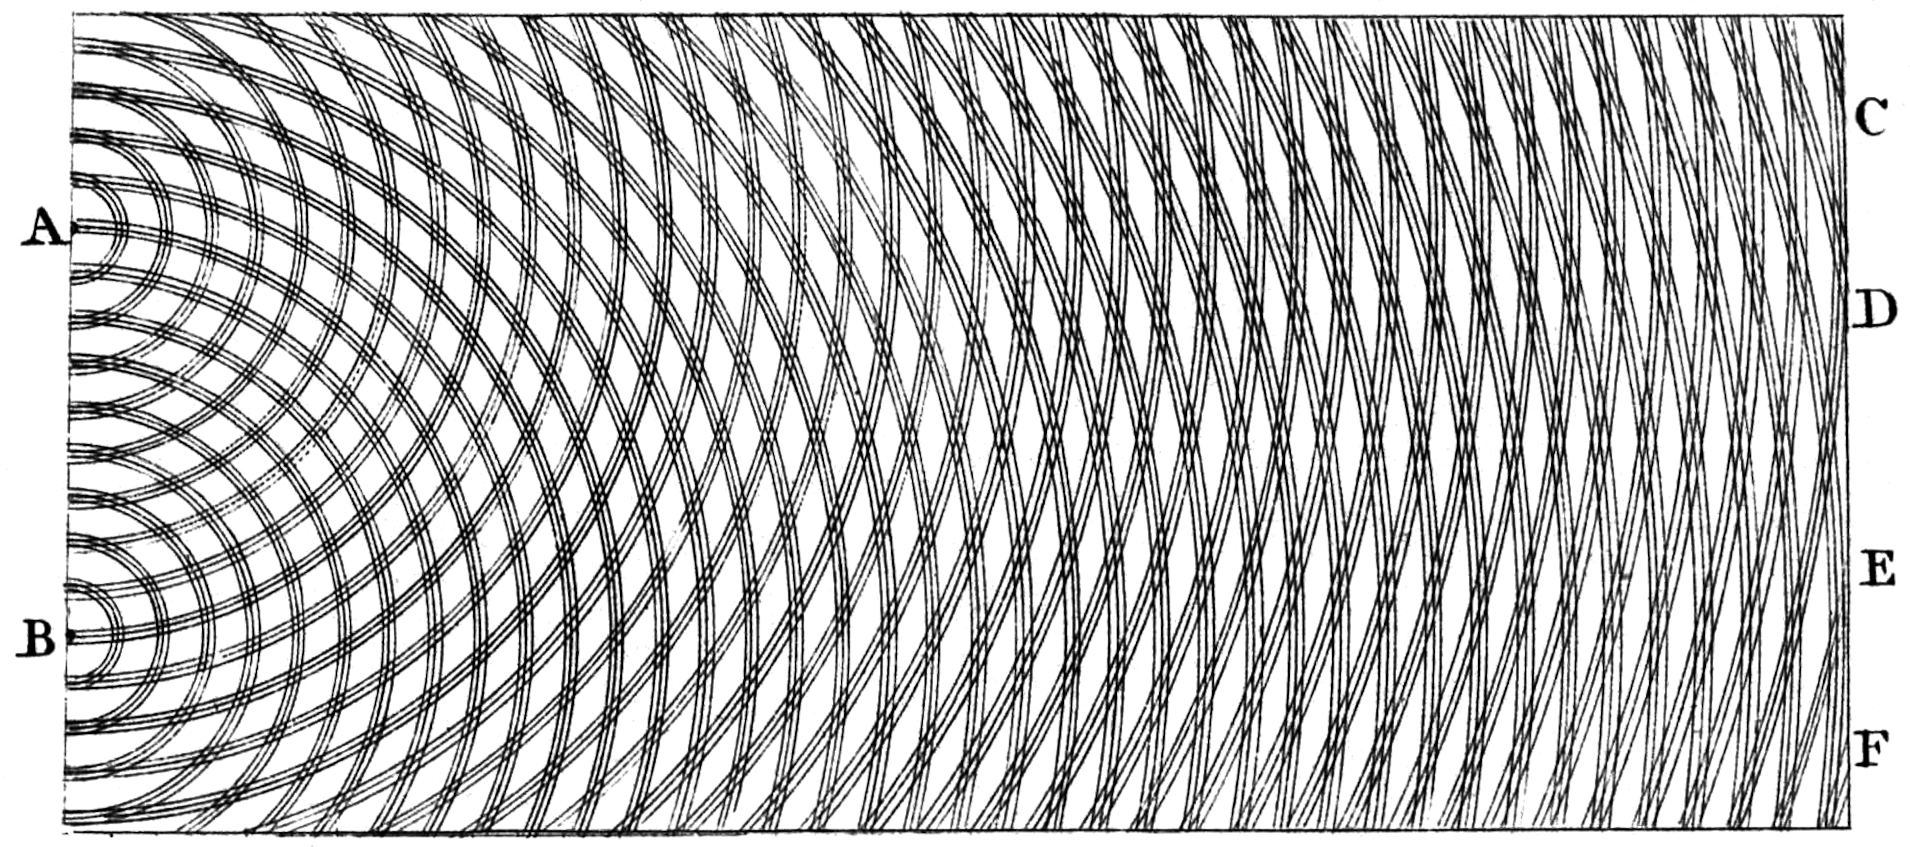
Original visualization by Thomas Young. Young chose the top view here: The lines correspond to wave crests, i.e. the crossed wave crests on the right-hand edge are the places of amplification, and the white lines are extinctions.
At the time, Young's publications were very stimulating for the discourse on the nature of light. In the dispute as to whether light is more a matter of particles or more of waves, the wave faction was able to decisively strengthen its position: in the classical view, particles would only collide with each other, but not interact with each other. The particles would therefore have to pass the slit in a straight line from the light source and thus only be allowed to leave two narrow illuminated beams as an image on the screen at the end of the setup. However, Young's experiment clearly showed that this was not the case.
David Rittenhouse invents the diffraction grating
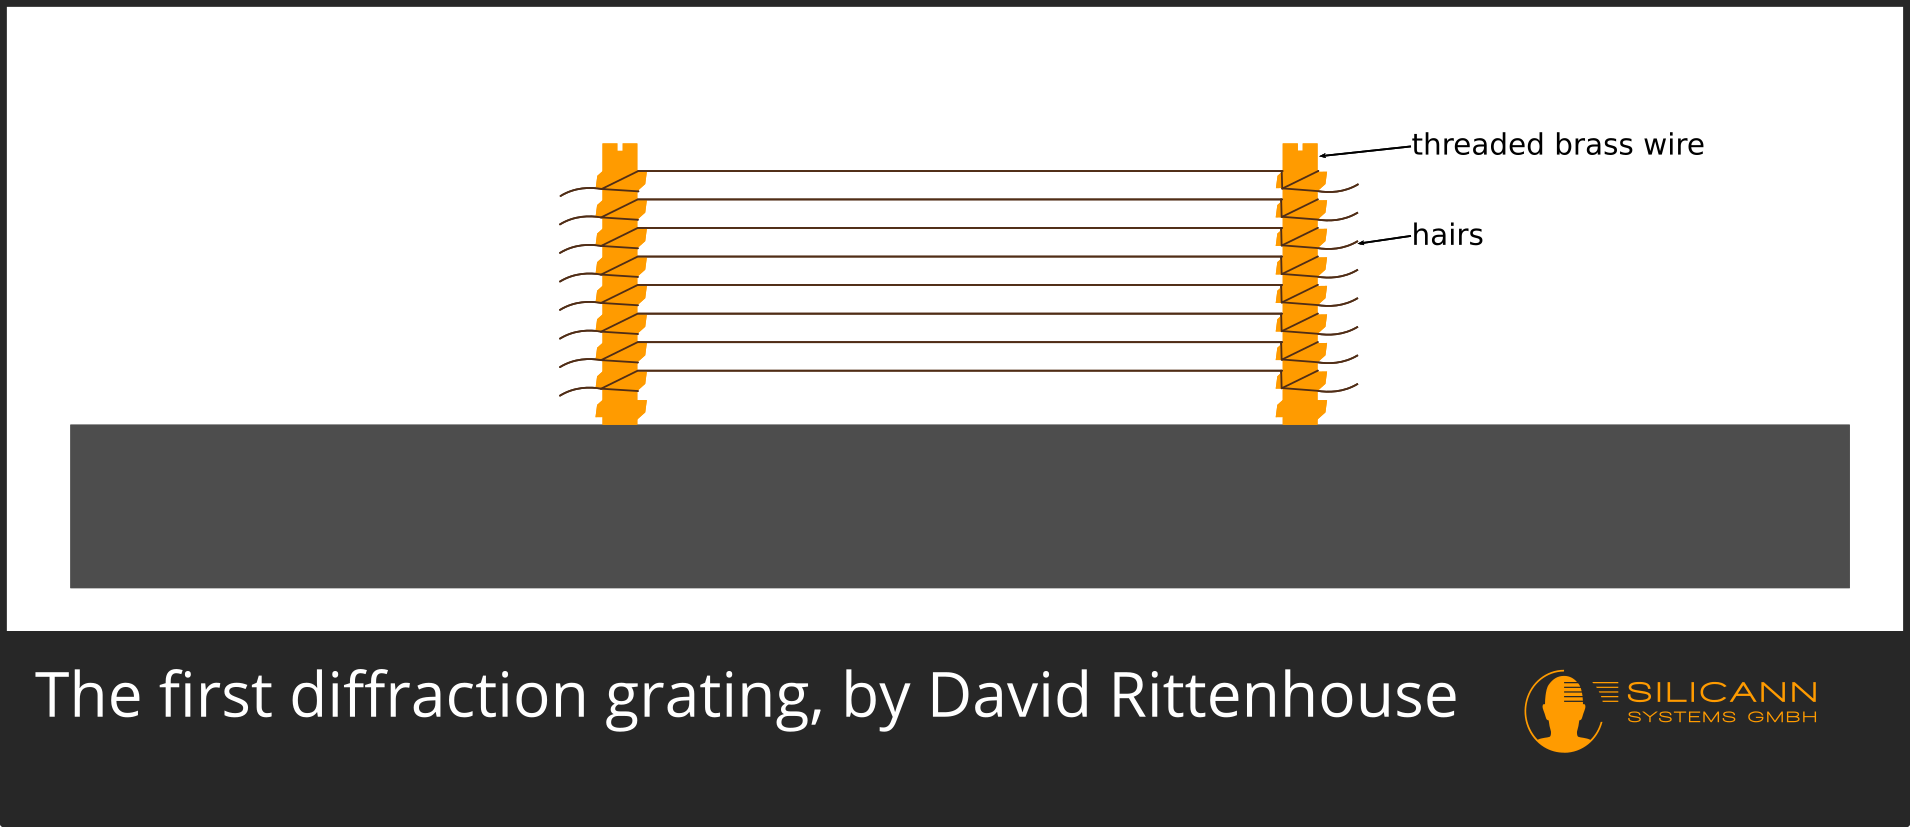
Born in the USA in 1732, David Rittenhouse was an autodidact who, even in his youth, revealed a talent for model making and mechanics in both theory and practice. Among other things, he constructed clocks and orreries, models of the solar system. His research focus was clearly located in astronomy. Of interest for the history of spectroscopy is the fact that Rittenhouse probably developed the first optical grating or diffraction grating. To do this, he fixated about 50 hairs with the help of fine screws in such a way that the distance between them, today known as the lattice constant, was about 0.1 mm (or about 190 lines per inch). We know about it today because Rittenhouse's reason for the invention can still be read in the Transactions of the American Philosophical Society, Volume 2. A person held a silk handkerchief to the light, close to the eye, and saw a pattern that at first glance looked like the individual silk fibers, but to his amazement remained in place as he moved the handkerchief back and forth. Rittenhouse, who was already intensively involved with Newton's publications at the age of 13, analytically deduced very sharply how the phenomenon could be optically derived. To validate his suspicions, Rittenhouse had a watchmaker cut two very fine threads in brass wire and thus was able to wrap individual hairs around the threads at a constant distance. Fraunhofer later used this approach to fabricate a diffraction grating for its spectroscope.
Wollaston's first spectroscope?
William Hyde Wollaston is usually only mentioned as a side note in spectroscopy, but is of interest on two counts. Once again, Wollaston's role survives through a Royal Society publication.
First, Wollaston has developed an interesting device for the precise determination of refractive indices based on Newton's development. In contrast to the previously common devices, its development enabled the measured refractive index to be read directly. Wollaston's variant also uses a cuboid prism, one side of which closes off a "sample chamber", a small depression in a wooden board. The sample lying there should touch the prism so that there is no air bridge between the material and the prism. A ray of light passed through the prism would be refracted at this surface. Since Wollaston's measuring device could also be set to precisely achieve the transition point from refraction to reflection, this made it also possible to measure samples that are completely opaque. This combination of precision and simple sample measurement makes Walleston's measuring instrument interesting because it allows optical material determination, albeit only on the basis of the refractive index. In fact, Walleston describes in his paper an example where an unknown sample from a Pacific island that did not appear to be home to bees at the time was determined to actually be beeswax by measuring the refractive index.
Walleston is better known as the originator of the first description of spectral lines. Looking through a flint glass prism at a beam of sunlight, he recognized a total of 6 lines, 2 of which marked the outer edges of the visible spectrum. This is probably also why Walleston thought he recognized them as the transitions between the different primary colors, of which there were apparently five (see Fig. 3 of his essay A Method of Examining Refractive and Dispersive Powers, by Prismatic Reflection). Contrary to the current statements in Wikipedia, however, it cannot be read from his essay that Walleston made these observations with his measuring device - apparently he just held a prism in a beam of light instead. Perhaps the reason for the discovery of the lines was the significantly higher quality of the glass used and the cut since Newton's research.
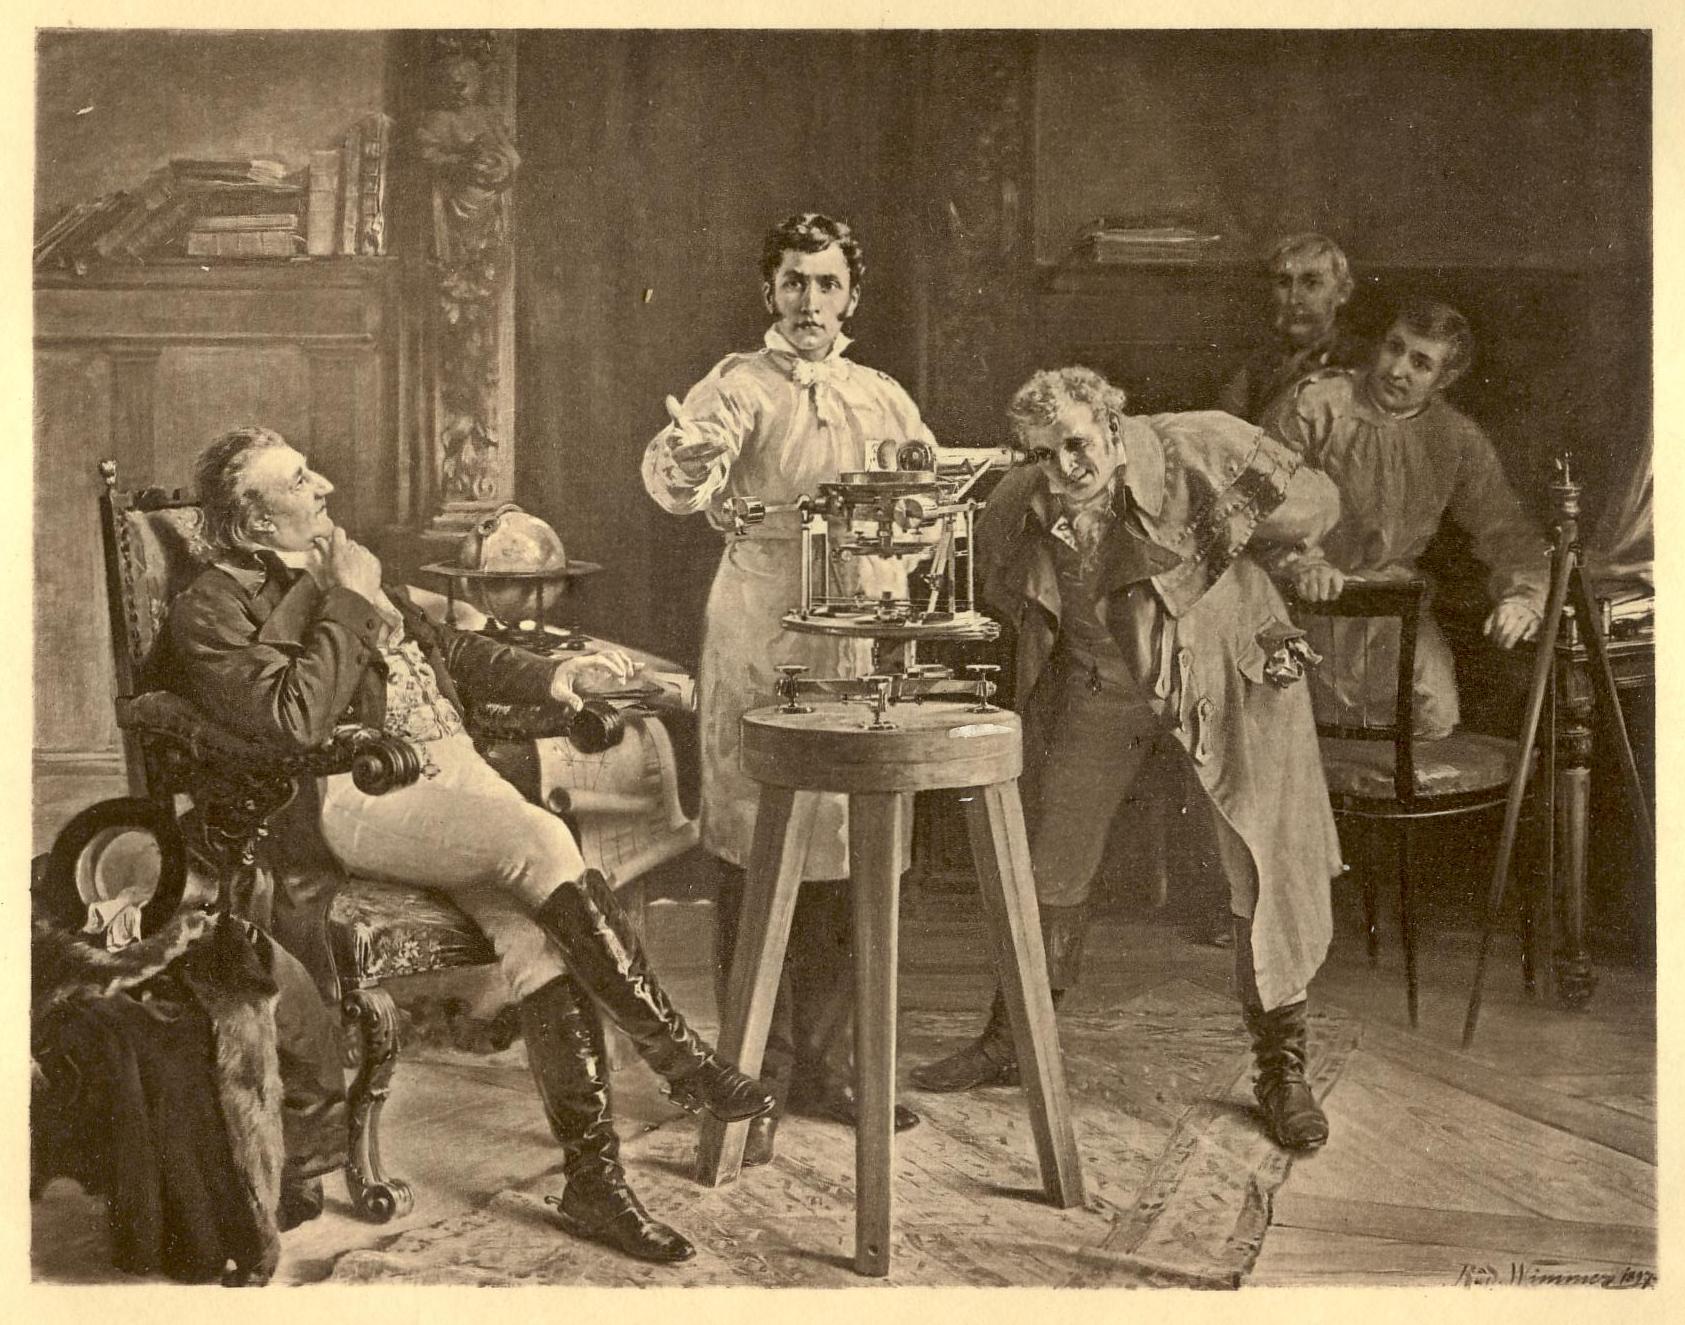
Fraunhofer's lines
A few centuries and countless theoretical and practical preliminary work later, with Joseph von Fraunhofer and the year 1814, we finally arrived at the construction of an actual spectroscope. Fraunhofer's achievements clearly lie in his practical inventions in the broader field of optical instrument making. Like Newton and Huygens, Fraunhofer also manufactured optical elements such as lenses himself and designed his own devices for the partial automation of this process. This allowed him to produce lenses of high quality, i.e. low aberrations.
In addition, Fraunhofer even manufactured the glass himself and invented his own kiln with which he was able to produce high-quality flint glass in a reproducible manner. This craft provided optical elements of outstanding quality, but like many glassmakers, it brought the physicist to his grave early: Fraunhofer died at the age of 39 because he was regularly exposed to the toxic vapors generated during the production process.
In the production of glass and its use in optical instruments, the precise determination of the refractive index is important. As described above, the experimental determination was no longer a secret for some time - but not overly precise either, because the rainbow spectrum of light only consists of continuous transitions, not discrete jumps. However, soft transitions make it difficult to precisely determine the extent of light refraction: the smooth transition between, for example, green and yellow makes it difficult to find exactly the same color tone elsewhere. As a result, there is already a potential measurement error when reading out the value, even if the device itself is very precise. To solve this problem, after unsuccessful attempts to produce homogeneous light directly, Fraunhofer invented a device that achieved this goal by fanning and filtering lamp light using prisms. He noticed a bright line in the orange area, which was always observed in the same place. It was perfect for precisely determining refractive indices. Fortunately, this did not satiate Fraunhofer's curiosity, and he used the same setup to analyze sunlight. Not only did this produce the same line as the lamplight, but many additional lines. Joseph Fraunhofer succeeded in describing more than 570 spectral lines over all experiments. From today's point of view, this device is clearly a spectroscope, even by strict definition.
Knowledge of these spectral lines also enabled very precise observation of the wavelength-dependent angle of refraction, since the individual color nuances could now be clearly distinguished from one another thanks to the lines. Since Fraunhofer worked in a company that manufactured optical instruments, this certainly had a direct impact on production there.
Joseph Fraunhofer later shifted the focus of his research interests to diffraction and interference. Again, a homogeneous light source was required for this. This time, however, Fraunhofer did not use prisms for this, but a diffraction grating. Again, Fraunhofer was able to find many of the spectral lines at the same locations in the spectrum. The results of his research work were apparently very precise, so that Fraunhofer was able to derive publishable generalizations from the observations made, which we can still read about today in the 8th volume of the Academy of Sciences. In the course of formalizing the observations, Fraunhofer used the principles of interference established by Thomas Young, who has already been mentioned here. Fraunhofer apparently even manufactured diffraction gratings himself in 1821 in order to check the effects predicted by Young's formulas, which could be produced with very fine-resolution diffraction gratings. The result of Fraunhofer's efforts was a diffraction grating with a resolution of 8000 lines per Paris inch (about 2.71 cm - even today the lattice constant of diffraction gratings is often described in lines per (imperial) inch - the 8000 lines per Paris inch correspond to approx. 7500 lines per inch used today). This was a finer diffraction grating than is used in most optical spectrometers today!
With Kirchhoff and Bunsen towards spectral analysis
Fraunhofer's development of an instrument for viewing spectra and the subsequent discovery of the famous lines in the solar spectrum was a major leap forward in the history of spectroscopy. A few decades later, Gustav Robert Kirchhoff and Robert Wilhelm Bunsen took this knowledge to a new level with an impressive combination of analytical rigor and disciplined empirical research. In a publication in the Annalen der Physik und Chemie, 1860, Kirchhoff and Bunsen describe the spectroscope they developed, with which they were able to develop the findings published there. The core of the instrument consisted of a hollow prism that was protected from external light and filled with the liquid carbon disulfide (the reason for this variant is not given - carbon disulfide has an almost identical refractive index to glass - perhaps the construction of a prism of a particularly high quality was the goal, since the liquid, unlike glass, was free from bubbles or other defects?). The prism was rotatably mounted so that any part of the spectrum could be targeted. For better comparability of different observations, a mirror was attached below the prism, outside the housing, with the help of which a scale became visible. Since the mirror rotated with the prism, this setup made it easier to find individual spectral lines with repeat accuracy. Two telescopes are aimed at the prism, one is intended for observing the spectrum, the other for directing the rays of the light source to the prism. With the latter, the ocular lens, i.e. the lens at the prism end of the telescope, was replaced by an adjustable slit. The light source, a flame, was positioned in such a way that the focus of its image was exactly in the slit. A vertical thread was attached to the ocular of the observation telescope in order to be able to more precisely determine the position of the lines in the spectrum.
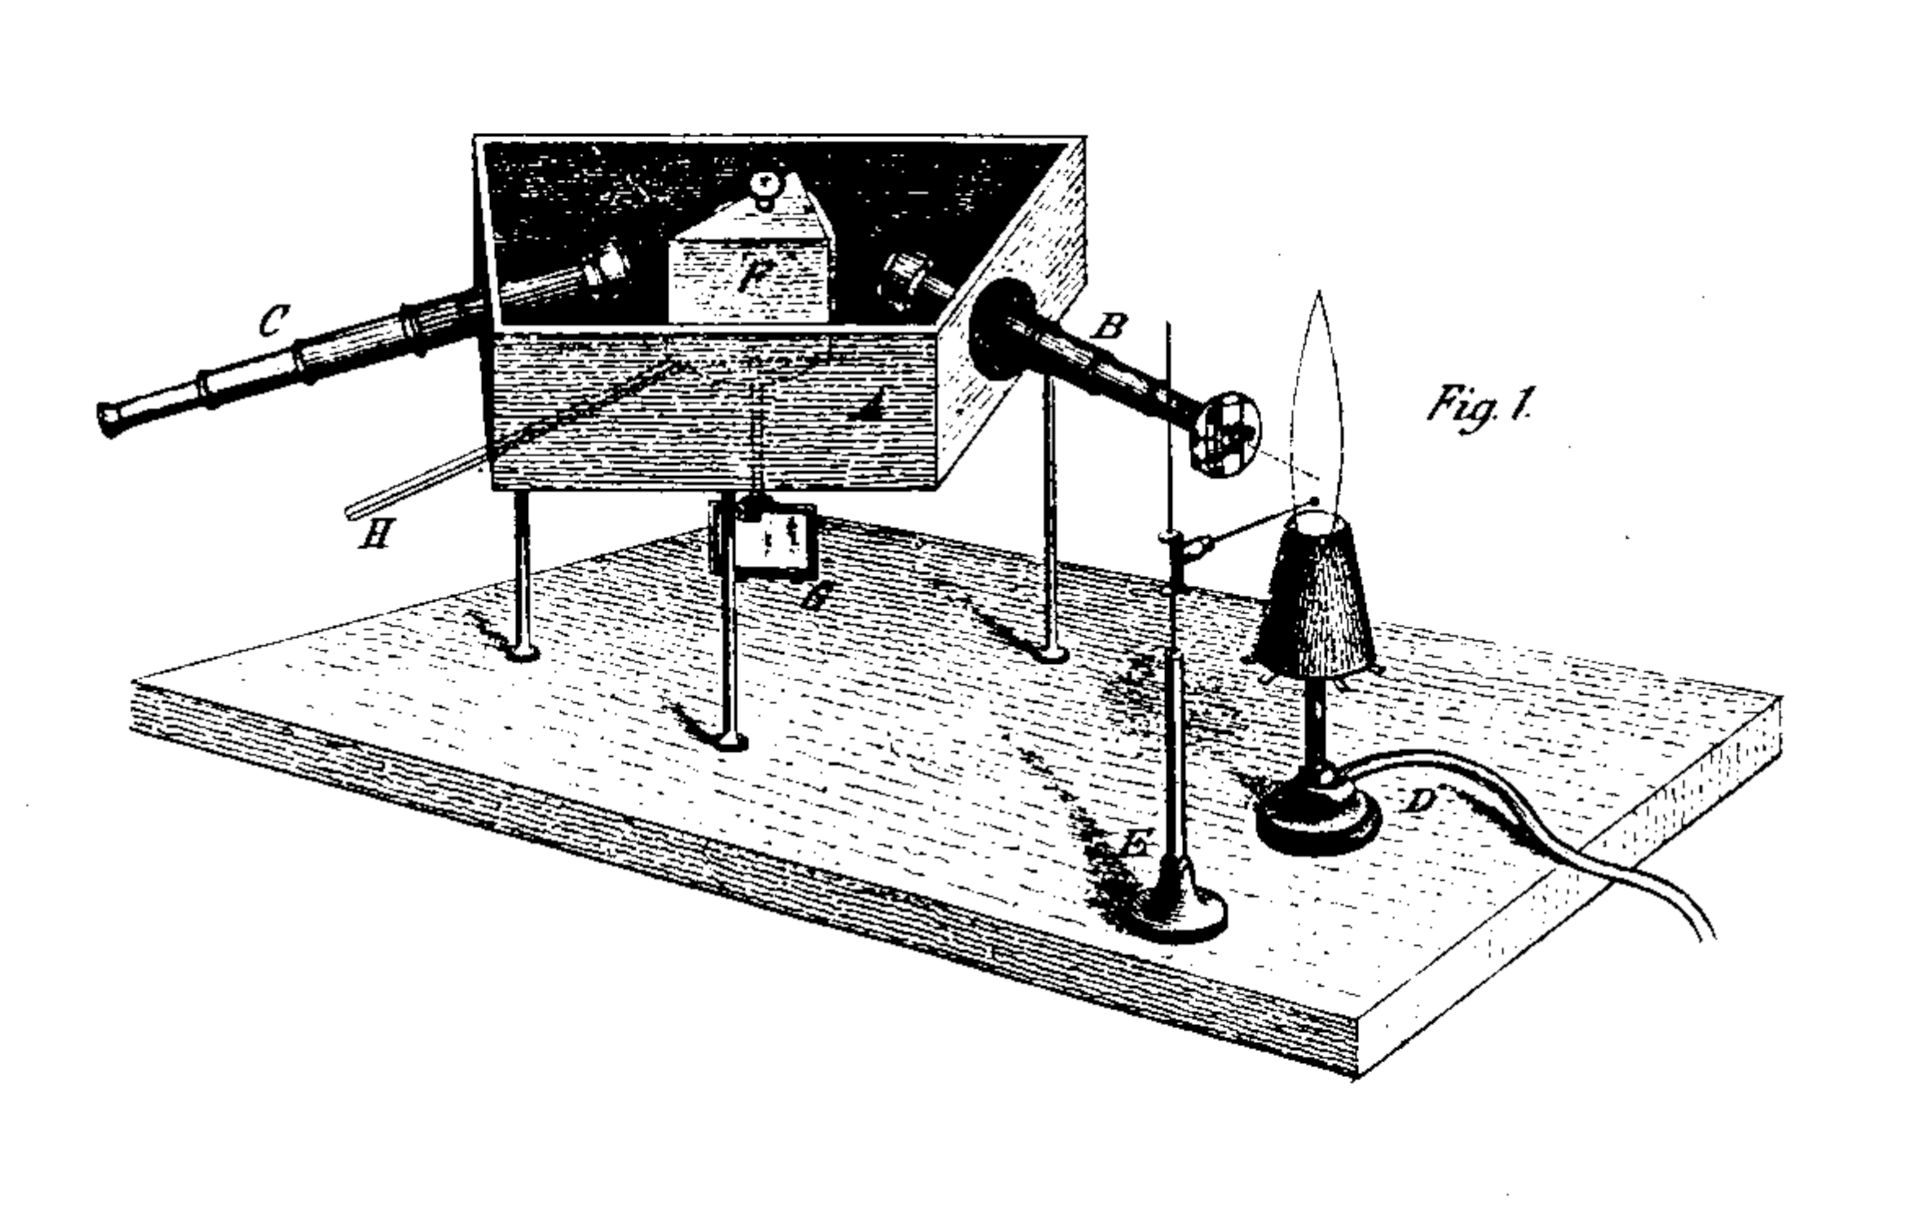
Original visualization of the spectroscope developed by Kirchhoff and Bunsen
Kirchhoff and Bunsen now mostly analyzed the different materials by burning small samples in the flame and analyzing the resulting spectral lines. With this experimental setup and a very large number of systematically varied investigations, the research team was able to decisively expand the knowledge of the spectral properties of many materials.
First of all, the two noticed that the individual metals examined always appear at exactly the same position in the spectrum, regardless of the compound in which they were examined. Unsure whether this observation can be generalized, in a first step they varied the temperature of the flame by choosing different fuels. They then devised a setup in which they made electrodes from the material to be examined, positioned them at a distance of 1-2 mm from each other, applied a correspondingly high voltage and spectrally analyzed the resulting arc. The result in both cases: Both the appearance and the position of the spectral lines in the spectrum remained unchanged.
Apparently, as Kirchhoff and Bunsen found out, the presence of certain spectral lines can clearly indicate the presence of the respective element, regardless of the specific compound in which the element is present. The spectral analysis is at least equivalent to the chemical detection methods known at the time.
When it comes to detecting very low concentrations of a substance, however, spectral analysis was already clearly superior as early as 1860. In the first paper, for example, an experiment is described in which 3 mg(!) of a sodium compound evaporated in the other corner of a room containing approx. 60 m³ of air. The sodium line then became clearly visible in the spectrum. This also explains the omnipresence of the sodium line when examining a wide variety of samples, because "[t]he earth is covered with a saline solution over more than two thirds of its surface", so that contamination with sodium was practically unavoidable under the conditions at that time. The same could be confirmed for lithium: although always in low concentrations, lithium could still be detected with the help of spectral analysis in a large number of soil and water samples from various sources. The effort that Gustav Robert Kirchhoff and Robert Wilhelm Bunsen put into their measurements can also be seen from the fact that, in addition to the local soil and water sources, they also examined seawater and the seaweed collected there, as well as wood from trees that grew on previously analyzed granite soil. In all of these cases, they were able to demonstrate the presence of lithium.
Also very interesting is the assumption published in the first paper that, in addition to the already known elements sodium, potassium and lithium, there is probably another previously undiscovered alkali metal, because that would explain some often observed but not yet assigned spectral lines. They then answered this research task themselves in the second paper published in 1861: after extracting the mother liquor from 44 t of spring water (mother liquor means the solid components in the water) and separating out all the known substances, a few grams of a substance remained. This substrance produced two clear lines in the blue area of the spectrum - Kirchhoff and Bunsen called it cesium. They then proceeded in a similar way with 150 kg of lepidolite from Saxony, a scaly-looking crystal. Here the previously unknown element produced lines mainly in the violet range and was named rubidium.
For their investigations, which were published in 1861, they were already using a further refined version of their spectroscope, which, among other things, was easier to use and made it possible to compare two spectra directly.
Nowadays, Gustav Robert Kirchhoff is mainly known as the eponym for Kirchhoff's law of thermal radiation, which was published as early as 1859. In a nutshell, it states that the radiation absorbed and emitted by a body must be in thermal equilibrium, i.e. a well-absorbing body will always emit well. This knowledge will later be the basis for Planck's law.
James Clerk Maxwell's Equations
The Scottish physicist Maxwell played a major role in the development of modern spectroscopy and spectronomy in several ways. First, Maxwell was on the trail of human color perception. Thomas Young had already assumed that the human visual system manages to distinguish the millions of possible nuances using only three primary colors: red, green and blue. Maxwell experimentally confirmed and specified this analysis. To do this, Maxwell fanned out lamplight with a lens and prism into a spectrum that was visible on a screen. Three moveable and closable slits were installed in the beam path, with the help of which any parts of the spectrum could be added together. With this setup, Maxwell was able to show, for example, that the combination of red and green produces yellow to our eyes and the mixture of red, green and blue leaves a white color impression. As a further result, we owe the production of the first color photograph to Maxwell's color research in 1861. It depicted a knotted piece of fabric in a plaid pattern. Since it wasn't printed on paper but on glass and then projected onto a screen, this color photograph was also an example of additive color mixing.
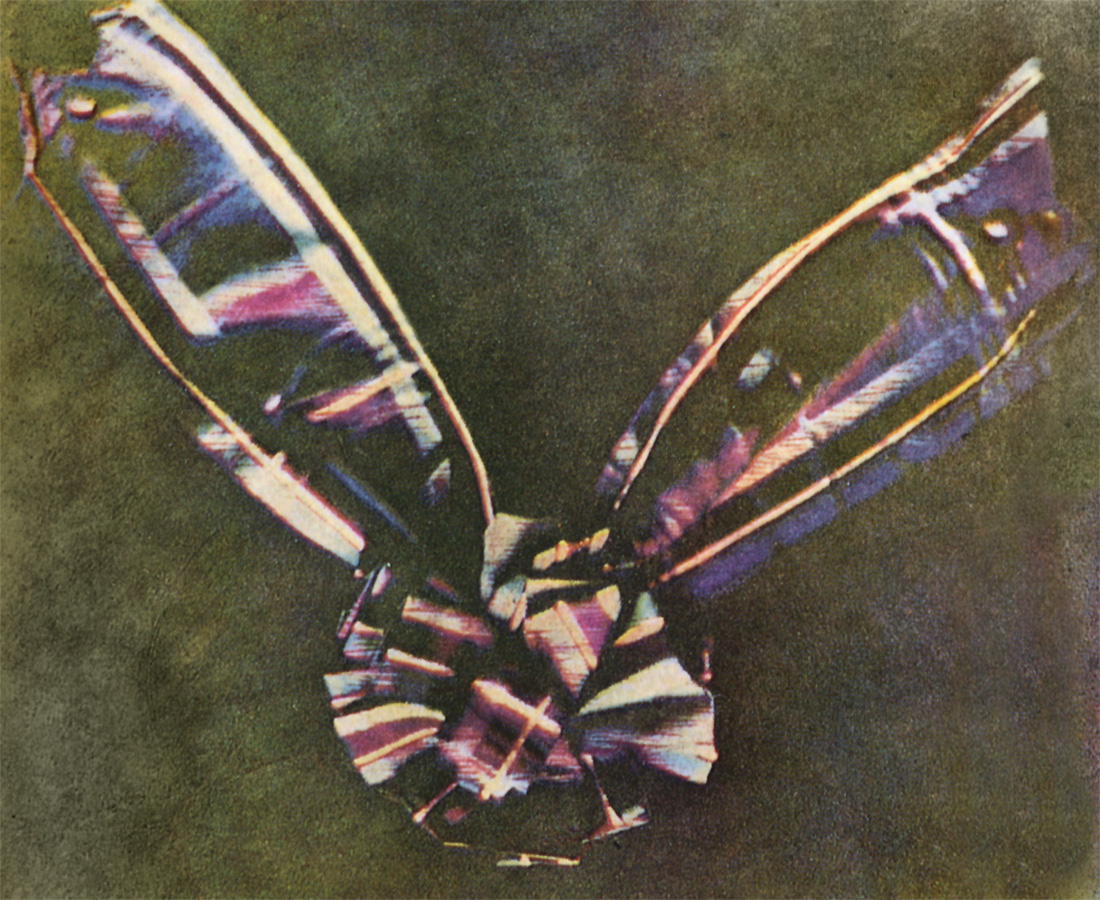
James Clerk Maxwell's first color photograph
It is also interesting that the source On the Theory of Three Primary Colors shows that in the middle of the 19th century the wavelengths of the visible spectrum were already known: Maxwell gave the color red with a frequency of 447 trillion oscillations per second, i.e. 670 nm, and green with 577 trillion oscillations per second, i.e. 520 nm (when reading the source it should be noted that at that time the long scale was still used in Great Britain, so a billion in the text corresponds to a contemporary trillion).
In order to be able to better evaluate colors and color distances, Maxwell also developed a description system for color differences, which differentiated between "hue", "tint" (the degree of saturation) and "shade" (the brightness). Maxwell used these dimensions for various color diagrams - and thus took an important step on the way to modern quantitative colorimetry. The current LCH color space, which is still in use, also uses the dimensions introduced by Maxwell (only "tint" is now called "chroma").
However, most will be familiar with James Clerk Maxwell for his work on electricity and magnetism. After studying the publications by Faraday and Ampère, Maxwell developed a set of differential equations that mathematically formalized and combined their research results. In this way, Maxwell was also able to confirm what was already suspected at the time: that electricity and magnetism are essentially the same thing. The formulas now known as Maxwell's equations still play an important role in describing electromagnetic fields. When calculating the speed of propagation of electromagnetic waves, Maxwell came up with a value of over 310 million meters per second - this was so suspiciously close to the speed of light that he strongly suspected that light and thermal radiation were also electromagnetic radiation, which only differed in wavelength. This was also a big step for spectroscopy, because it made it possible to describe electromagnetic radiation beyond the limits of visible light in a uniform way.
Planck's law
Max Planck almost wouldn't have become a physicist - before choosing his studies, Planck, who had a wide range of interests, was still hesitating between music and physics. The prospect of better employment options is said to have been the deciding factor for him at the time. He quickly completed his studies to become a physics teacher, during which he attended lectures by Kirchhoff, among others, and received his doctorate in 1879, just one year after his state examination (the degree concluding the studies of a teacher). In 1880, when Max Planck was 22, his habilitation took place. Initially, Planck had no appointment and therefore held lectures in Munich free of charge (or rather at the expense of his parents, who financed him). In his lectures he examined various physics core topics from a theoretical perspective. In 1885 he was called to Kiel to a newly established professorship for theoretical physics. At that time there were only two chairs for theoretical physics in Germany, which was regarded as an auxiliary science compared to experimental physics. With his professional career secured by taking over this chair, Planck was now able to turn to longer-term research projects.
From the mid-1890s, Max Planck devoted himself to the theory of thermal radiation. Planck's goal was to derive the radiation laws from thermodynamic considerations, which he had already dealt with in depth during his doctorate. Central to this was work on black body radiation, i.e. the search for the laws that predict the form in which heated black bodies emit thermal radiation.
The concept of the black body was introduced by Kirchhoff about 40 years earlier. The black body is an idealized body that absorbs all incoming electromagnetic radiation and reflects nothing. Any radiation emitted by this body is then inevitably transmitted by itself. The exact spectrum of the thermal radiation emitted is therefore exclusively dependent on the temperature of the black body. This physical model allows a simplified view of the processes without considering special cases. At the same time, the model also specifies upper limits for real bodies: A real body, for example, cannot emit more thermal radiation than an idealized black body at any wavelength.
As early as 1859, Kirchhoff had said that there must be a universal equation, dependent only on frequency and temperature, that precisely describes the thermal radiation of a black body. However, the search for this equation turned out to be quite complex, and over the next few decades physics only came closer to solving this riddle in small steps. In 1879, Josef Stefan was able to determine the connection between energy density and temperature. Based on this, in 1884 Ludwig Boltzmann was able to develop an equation for determining the total radiation of a black body as a function of its temperature, known today as the Stefan-Boltzmann law. In 1893, Wien's displacement law followed, named after Wilhelm Wien. In 1896, Wien published its proposed solution to blackbody radiation, which at the time initially seemed to confirm the experimentally collected data on thermal radiation, taking into account measurement tolerances, which were still quite large at the time. An alternative followed in 1900 by John William Strutt, 3rd Baron Rayleigh and James Jeans, the Rayleigh-Jeans law, which was also intended to cover the spectrum of blackbody radiation, but apparently only worked for low frequencies.
Starting in 1895, Max Planck published several times a year on the same topic. Then, in December 1900, his research culminated in what is now known as Planck's law: a precise calculation of blackbody radiation, valid for both high frequencies (contrary to the Rayleigh-Jeans law) and low frequencies (the weak point of Wien's radiation law).
However, the development of Planck's law had far greater consequences for physics than the predictability of thermal radiation: in retrospect, it heralded the beginning of the age of quantum mechanics. During the development of the equation, Planck adhered to the axioms of classical physics for a very long time. In a step that Planck described retrospectively in an exchange of letters as an "act of desperation", Planck adopted Boltzmann's atomistic-probabilistic justification of the entropy in the equation. The radiation oscillators (the particles of the black body) can therefore not assume any states, but only switch between discrete steps. Accordingly, they cannot be excited with any arbitrary amount of energy, but require certain minimum amounts of energy.
If this were not the case, if instead any quantity of energy were sufficient for excitation, as in the Rayleigh-Jeans equation, then the integration over all frequencies would result in infinite quantities of energy, which would be a difficult statement from a thermodynamic point of view (this weak point of the Rayleigh-Jeans law was subsequently referred to as an "ultraviolet catastrophe", because the problem is particularly evident at high frequencies - but that played no role in Planck's derivation at the time).
If the thermal energy is just above the minimum limit necessary for the excitation, then the oscillators will be excited with a certain probability, which is greater the greater the exciting energy is above this minimum limit. This is the atomistic-probabilistic-theoretical consideration that Boltzmann introduced. Oscillators or oscillation states with a small minimum energy, i.e. low excitation frequencies, are therefore excited much more frequently and therefore behave more in accordance with the assumptions of classical physics.
Accordingly, the exchange of energy between oscillators and the electromagnetic field is not continuous, but takes place in the form of very small energy packets - the quanta. While Planck at that time only used these quanta to describe the energies, Albert Einstein postulated 5 years later that they actually are the electromagnetic radiation itself. Today we call these quanta photons.
To this day, Planck's law of radiation has a very concrete influence on spectroscopy, especially for astronomy. If you consider stars as approximately black bodies, then you can, for example, derive the temperature of the star from the radiation they emit. The cosmic background radiation also behaves roughly like the thermal radiation of a black body - which has a temperature of less than 3 Kelvin.
And we also encounter blackbody radiation regularly in everyday life - it explains the ominous descriptions of the color temperature of lamps. A light source with the specification 3000 K corresponds to blackbody radiation which has a radiation maximum in the near infrared, so that its visible light is mainly in the reddish part of the spectrum. So it emits "warm" light. On the other hand, a 6000 K lamp also supplies more light in the bluish range - just like our sun, which has a surface temperature of almost 6000 K.
From spectroscope to spectrometer
Spectroscopes are still used today, but mainly in astronomy, which, when observing distant stars, often has to work with such small amounts of light that the spectral lines are already an extremely useful source of information.
However, the discovery of quantum mechanics also enabled the development of devices that can determine the amount of electromagnetic radiation hitting them: the photodiodes. And this also made it possible to develop spectrometers, measuring devices that not only show the absence of individual wavelength ranges, as spectroscopes do, but can also determine the intensity of the incoming radiation for each wavelength.
Spectrometers are used in a wide variety of ways today. For example, unknown substances can be identified through their spectral curves because certain elements and molecules have very characteristic absorption properties, as we know since Kirchhoff and Bunsen. In this way spectrometers are also used, for example, for monitoring drinking water quality. Materials research sometimes works the other way around: the chemical structure of a molecule under investigation can be used to calculate how it would react to radiation before it is actually produced. A spectrometer can then clarify whether a chemical reaction has successfully produced the substance of interest. And just as astronomy measures stars spectrometrically, spectrometers can also evaluate light sources and surfaces on earth, and thus predict metamerism effects, for example. And in the healthcare sector there is currently happening a lot of research on e.g. how to detect contamination on surfaces, pathogens in samples or analyzes of blood samples, all purely by optical inspection, using spectrometers.
History and reality
History always only describes a very specific view of what really happened. Countless important people remain unnamed, findings from outside of Europe were often not clearly given as a source or rediscovered with great effort in ignorance. Intrigues have certainly ensured that we now sometimes remember people whose documented personal contribution was perhaps not their own.
But even regardless of this, one could still write about spectroscopy from a completely different perspective. While the theoretical knowledge about the spectral nature of light was in the foreground here, there were also many individual steps in technical progress at the same time. Glass that was as colorless as possible had to be produced. Prisms could be made from that glass. However, their quality not only depended on the transparency and absence of defects such as air inclusions, but also on the flatness of their surfaces. Mirrors were made in many different ways, such as different polished metals or coated glass. Convex and concave lenses with ever more uniform surfaces and ever larger diameters were ground. While all of these components have been manufactured entirely by hand for centuries, there will always have been parallel efforts towards mass production. Serial production facilitates reproducible results, and in this way also reproducible scientific investigations, which are now less dependent on the quality of a single optical component. A technical history of spectroscopy might therefore be just as interesting.
Sources
- Isaac Newton: New Theory about Light and Colors. Philosophical Transactions [of the Royal Society of London], 1671
- Thomas Young: The Bakerian Lecture. Experiments and Calculations relative to physical Optics. Philosophical Transactions of the Royal Society of London, 1803
- D. Rittenhouse: Explanation of an Optical Deception. Transactions of the American Philosophical Society, Vol. 2, 1786
- William Hyde Wollaston: A Method of Examining Refractive and Dispersive Powers, by Prismatic Reflection. Philosophical Transactions of the Royal Society of London, 1802
- Joseph von Utzschneider: Kurzer Umriß der Lebens-Geschichte des Herrn Dr. Joseph von Fraunhofer, 1826
- G. Kirchhoff, R. Bunsen: Chemische Analyse durch Spectralbeobachtungen. Erste Abhandlung. Annalen der Physik und Chemie, 1860
- G. Kirchhoff, R. Bunsen: Chemische Analyse durch Spectralbeobachtungen. Zweite Abhandlung. Annalen der Physik und Chemie, 1861
- J.C. Maxwell: On the Theory of Three Primary Colors. Lecture at the Royal Institution of Great Britain, 1861
- and Wikipedia entries of the respective scientists
You might also like

AI-Assisted Development for Spektralwerk Spectrometers
The Spektralwerk API documentation is now available as an MCP server. This facilitates AI-assisted development, particularly in security-conscious companies.