Spectrometry in the Food Industry

For decades, food quality was determined wet-chemical methods. Fat extraction in a Soxhlet apparatus for fat content, Kjeldahl digestion for protein content, drying oven for moisture. These procedures took hours and were laborious to perform.
Today, NIR process spectrometry delivers the same parameters in real time, directly in the running product stream, without chemicals. What began in the dairy industry with milk payment accounting based on fat and protein content is now a standard tool across the entire food production sector.
What Absorbs Where? The Spectral Fingerprint of Foods
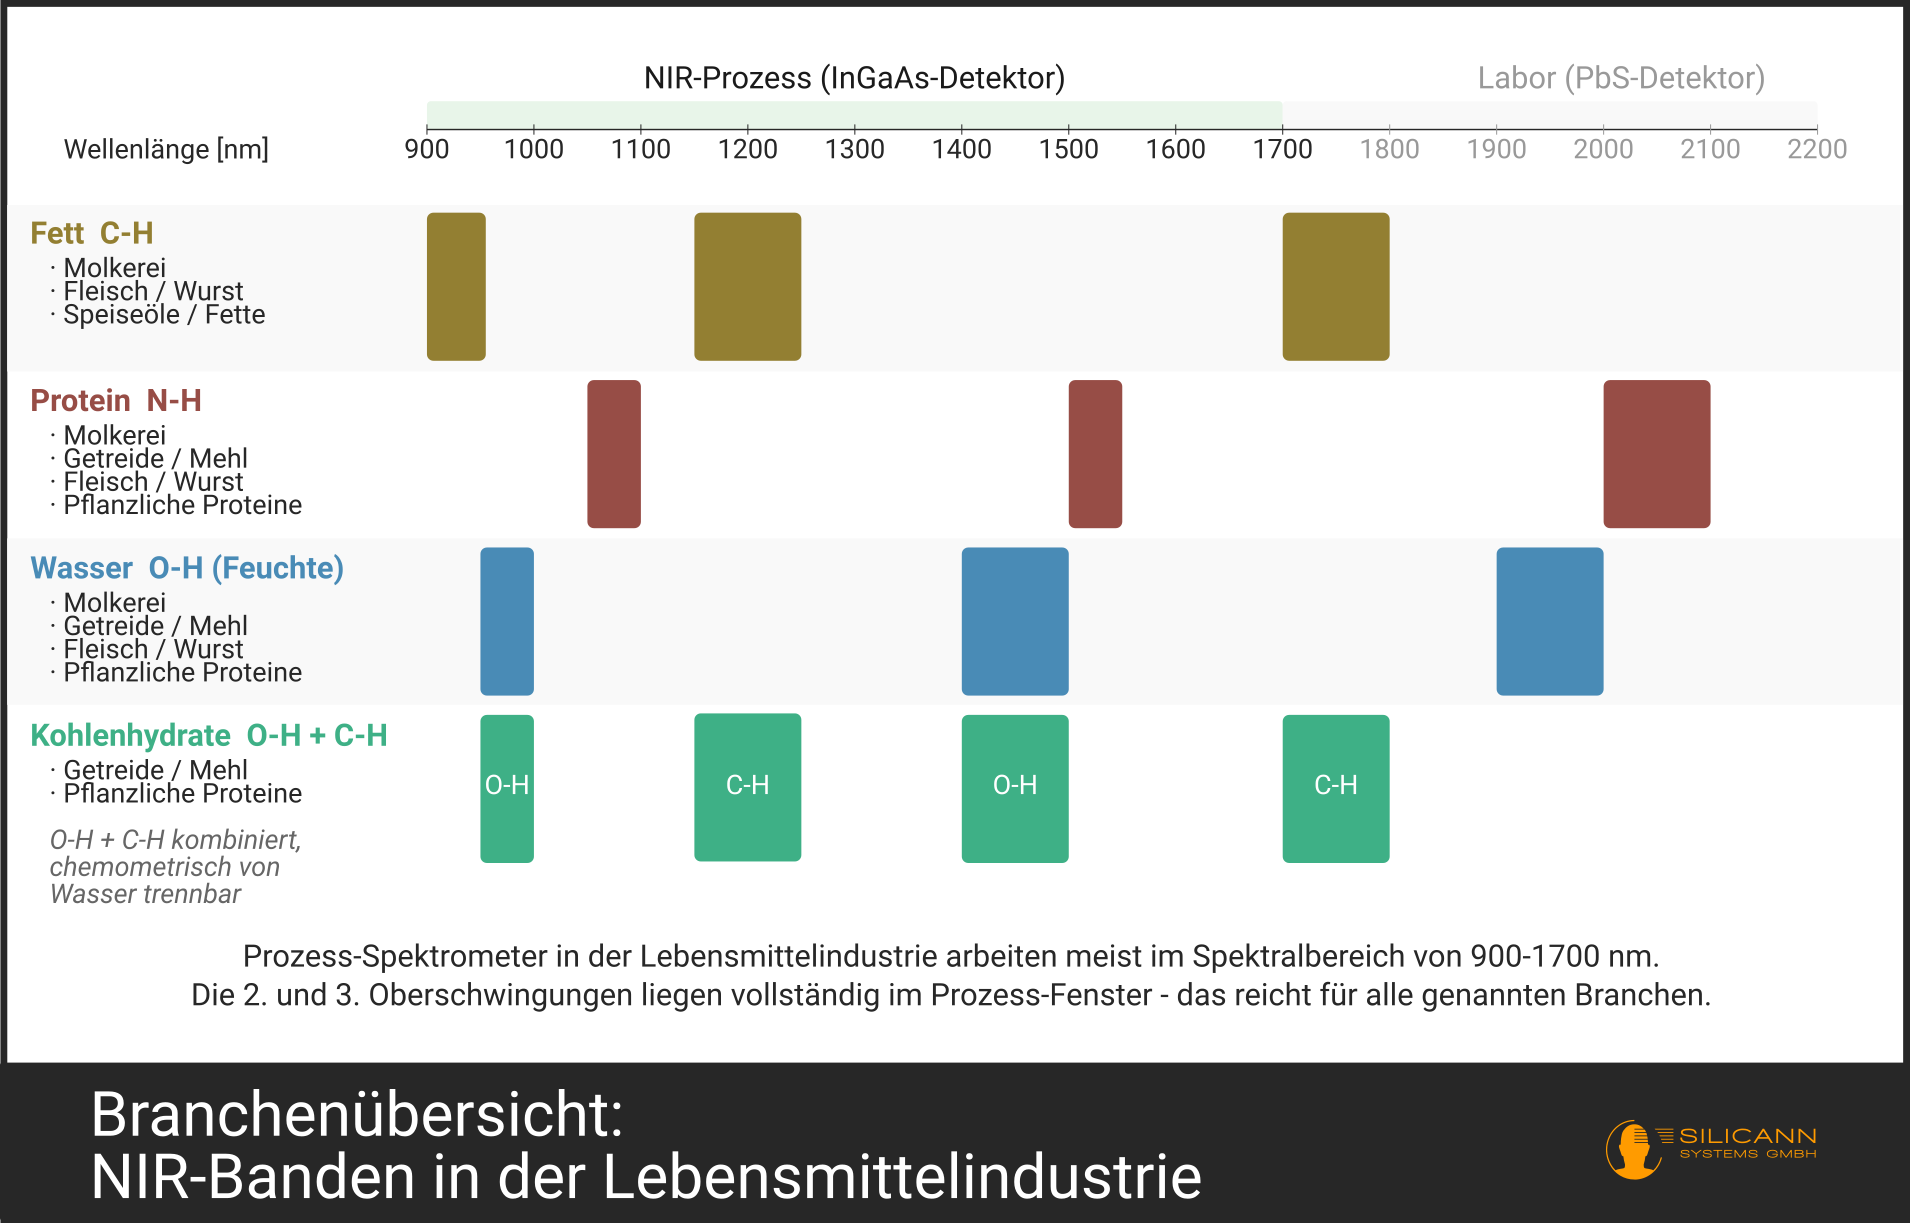
The chemical building blocks of foods can be identified in the NIR by their characteristic overtone bands. This is the same physical principle described for individual molecular bonds in fundamental and overtone spectrometry:
| Parameter | Functional Group | Typical NIR Absorption Ranges |
|---|---|---|
| Water / Moisture | O-H | around 1450 nm, around 1940 nm |
| Fat | C-H (long-chain) | around 1200 nm, around 1720 nm, around 2300 nm |
| Protein | N-H, C-H | around 1500 nm, around 2050 nm, around 2180 nm |
| Carbohydrates / Sugar | O-H, C-H | around 1450 nm, around 1580 nm, around 2100 nm |
Unlike mid-infrared (MIR), NIR does not see sharp fundamental vibrations, but rather broader overtones and combination bands. This may sound unfavorable at first, but in practice it is often a decisive advantage: overtones and combination bands are quantum-mechanically far less probable than fundamental vibrations - their absorption is correspondingly orders of magnitude weaker than in the MIR. For this reason, NIR radiation penetrates several millimetres to centimetres into the product: deep enough to measure thick product streams, meat pastes, or free-flowing powders. MIR radiation, by contrast, is completely absorbed after just a few micrometres, and therefore reaches its limits with inhomogeneous products.
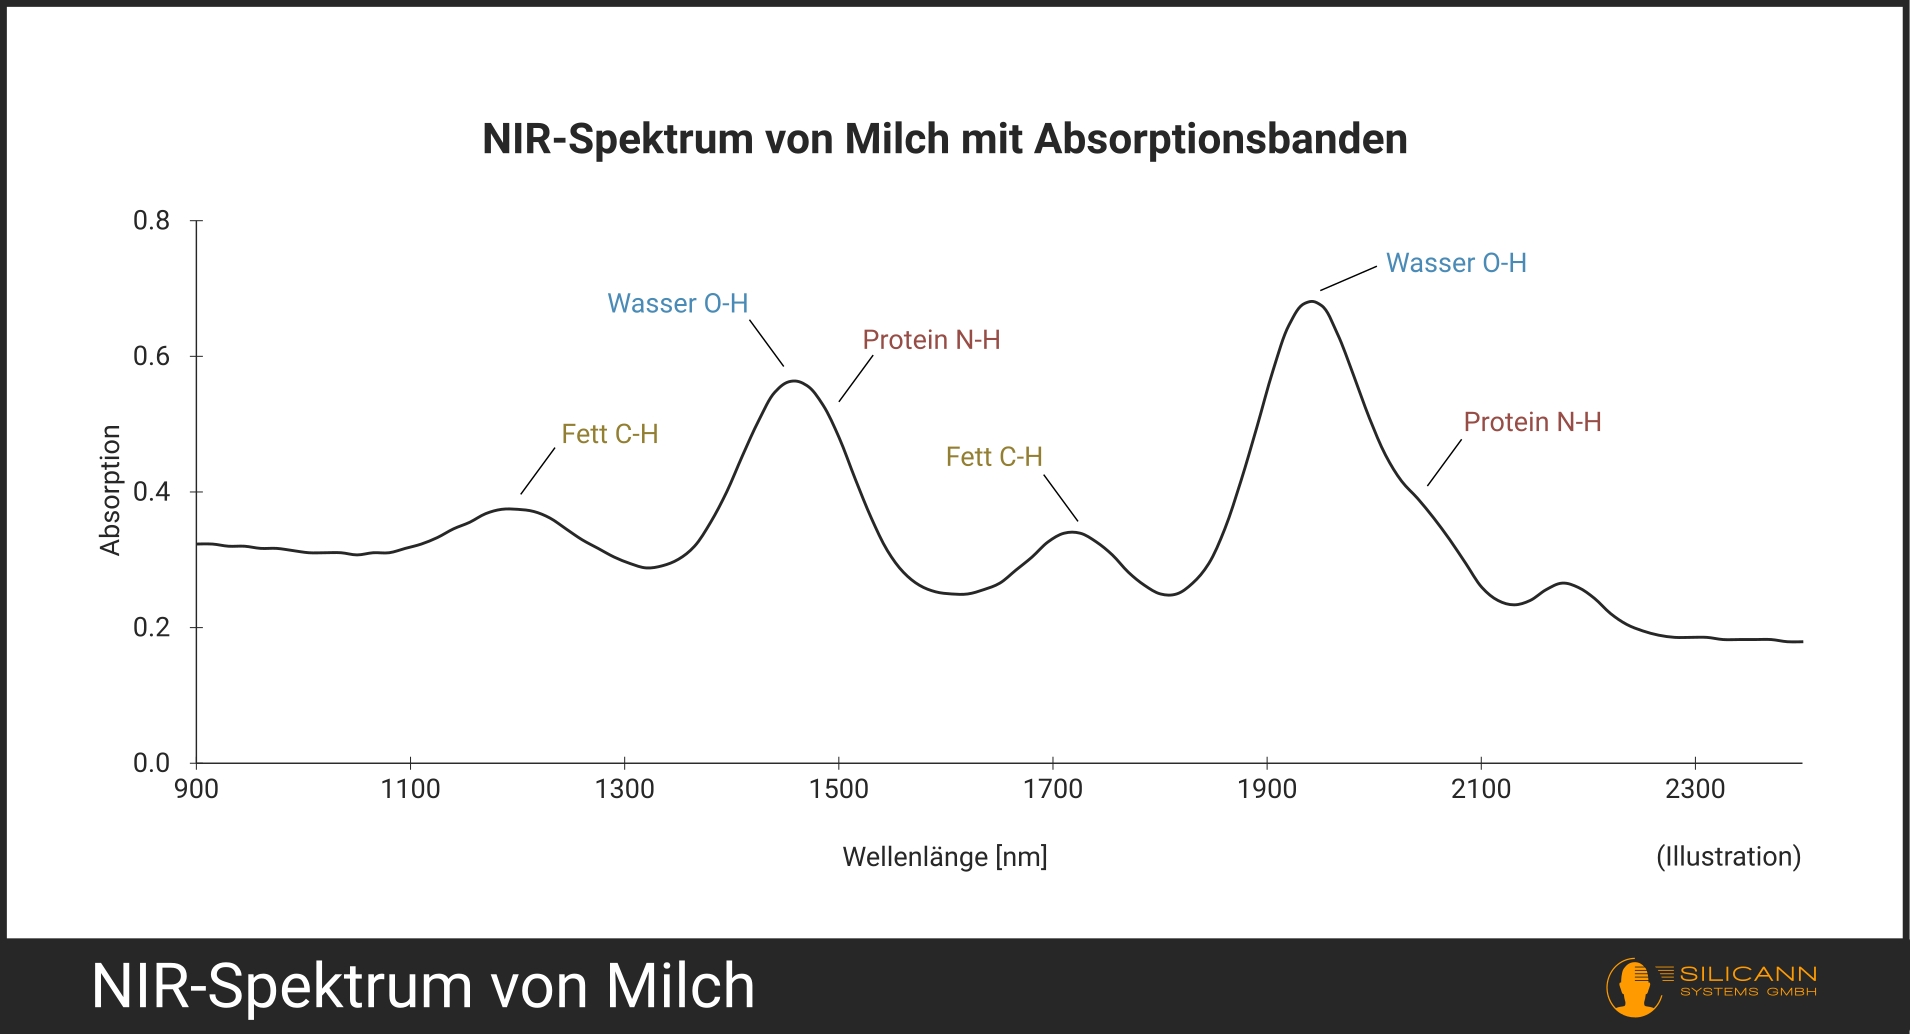
In practice, NIR measurements do not look at individual peaks ("Peak X = Substance Y") but rather at the entire spectrum. From the hundreds of simultaneously measured wavelengths, a PLS model extracts the parameters of interest. Calibration requires a few dozen samples with reference values determined in parallel, a one-off effort that pays for itself over thousands of subsequent measurements.
Alongside the near-infrared, there is also an important application in the UV range: monitoring edible oil quality. Conjugated dienes, oxidation products of unsaturated fatty acids and therefore direct indicators of incipient rancidity, absorb at 232 nm. Conjugated trienes, the next stage of oxidation, appear at 268 nm. These substances are virtually invisible in the NIR because their concentrations are very low and their absorption bands are masked in the NIR by the dominant C-H vibrations of the intact fatty acids. A simple UV spectrometer, however, makes them selectively visible.
Typical Applications and Process Parameters
Dairy Products
No industry has integrated NIR spectrometry as deeply into its processes as the dairy sector. At milk intake, the inline spectrometer determines the milk payment accounting: fat and protein are measured in the flow while the tanker truck is being emptied.
Further measurement points follow in production: after the centrifuge, an NIR spectrometer monitors the fat content of the skim milk and cream. In the standardization tank, a bypass system continuously checks whether the fat and protein content meet the recipe. Before filling, a final measurement checks the finished drinking milk or the yoghurt base. In modern dairies, laboratory samples are taken only for calibration maintenance and microbiological testing. The routine analytics is handled by the spectrometer network.
Typical parameters: fat, protein, dry matter, lactose, non-fat dry matter.
Grain, Flour, and Bakery Products
Mills were pioneers of NIR technology: the first instruments for wheat intake control were deployed as early as the 1980s. Today, spectrometers measure inline at the mill outlet: moisture, protein (and thus indirectly the gluten content), ash (mineral content, determined by incineration at ≈900 °C, as an indicator of the extraction rate), and the water absorption of the flour.
Unlike the dairy industry, the sample material here is not liquid but free-flowing powder. This requires different optics: instead of transmission cuvettes, diffuse reflectance probes are used. The measurement takes place directly on the flour stream flowing past a sight glass in the pipe. Any fluctuation in moisture is detected immediately and can be corrected by adding water before the incorrectly adjusted batch reaches the silo.
Typical parameters: moisture, protein (gluten), ash, water absorption, starch content.
Meat and Sausage Products
Meat processing presents special challenges: the material is inhomogeneous, with variable marbling from batch to batch, and fluctuating fat and connective tissue content. A homogenized laboratory sample exists at most for reference analysis; the process spectrometer must measure directly on the coarse sausage emulsion.
That is exactly what happens: an NIR process spectrometer at the cutter or grinder measures fat, protein, water, and collagen (i.e. the connective tissue content) continuously on the passing material. The values go directly to the control system: automatic fat standardization by adding lean or fatty raw material, second by second. This not only saves laboratory time but also reduces the expensive "fat safety margin" traditionally used to reliably meet the legal minimum content despite fluctuations.
Typical parameters: fat, protein, water, collagen (BEFFE).
Plant-Based Protein Products
The fastest-growing category in the food industry is an ideal field for NIR process spectrometry, precisely because production is often only now being standardized for industrial scale, and robust inline quality control creates competitive advantages.
Tofu and soy products: Protein, moisture, and fat are measured directly at the outlet of the soy milk coagulation. Quality control begins one step earlier: soy protein isolates, the raw material for many downstream products, are specified inline at intake before entering production. A growing market, since soy protein, at around 90% protein content (dry matter), is the most concentrated plant-based protein raw material.
Pea and lupin protein isolates: Protein content is the key quality characteristic and determines the price. Typical specifications lie at 80-90% protein in dry matter. NIR measures this value in real time during spray drying or directly in the powder stream - without Kjeldahl digestion, which takes a good two hours per sample. Moisture content is also critical, because residual moisture determines the shelf life of the isolate.
Meat substitute masses: The simultaneous determination of protein, moisture, and fat in the running extruder or mixer permits continuous recipe control for patties, plant-based sausages, or minced-meat substitutes. Particularly relevant: during the thermal texturization of pea protein in a twin-screw extruder, the moisture content of the product determines the mouthfeel of the end product. Too dry means chalky, too moist leads to a spongy texture. NIR spectrometers check this parameter inline and thus avoid production waste.
Seitan and wheat gluten products: Here, protein (gluten) dominates, with proportions of over 75% dry matter in the raw materials. NIR spectrometry captures it via the characteristic N-H bands at 1500 and 2050 nm, supplemented by moisture and residual fat. The production of seitan base blocks, traditionally an artisanal process of washing starch out of wheat dough, is increasingly automated, and NIR can monitor this washing process via the decrease in residual starch content.
Typical parameters: protein, moisture, fat, starch (for seitan production).
Edible Oils and Fats
Edible oil analysis combines NIR and UV - one of the few places in the food industry where both technologies interact in process control.
In the NIR, the classic fat parameters are determined: free fatty acids (FFA) as an indicator of hydrolytic spoilage, iodine value as a measure of the degree of unsaturation, and peroxide value as a marker for incipient oxidation. Additionally, authenticity can be checked: more severe adulteration of olive oil with cheaper oils is visible in the NIR spectrum as subtle deviations in the fatty acid pattern.
The UV measurement adds the oxidized compounds that are easily lost in the noise of the intact fatty acid bands in the NIR range: absorption at 232 nm (conjugated dienes) and 268 nm (conjugated trienes) increases long before the oil perceptibly smells rancid. A UV process spectrometer in the bypass of the refining line detects incipient oxidation before the batch becomes unsaleable. That is a genuine early-warning indicator that NIR measurement alone cannot provide. However, this application is restricted to clear, filtered oils. Turbid or unrefined pressed oils are therefore usually measured atline: the sample is drawn, clarified, and analysed externally. The result then arrives with a delay, meaning that a faulty batch may already have been further processed and then produces waste.
Typical parameters: free fatty acids, iodine value, peroxide value (NIR); conjugated dienes (UV, 232 nm), conjugated trienes (UV, 268 nm).
From Lab to Process
Process spectrometry no longer measures in a temperature-controlled laboratory at 20 °C in a quartz cuvette. Instead: milk at 40 °C in a pipe, flour as a free-flowing powder on a conveyor belt, minced meat mass with fluctuating homogeneity. This systematically alters spectra: temperature shifts the position of absorption bands, scattering from particles or inhomogeneous surfaces changes the baseline, and the unavoidable product inhomogeneity leads to more noise.
In practice, a staged approach has proven successful: the laboratory spectrometer is used for the initial calibration, because the reference values are determined there by wet chemistry with the highest precision in any case. The calibration is then transferred to the process spectrometer using a separate transfer procedure -- the article on spectral normalization describes this process in detail. If needed, regular recalibrations with a small number of process samples analysed in parallel by wet chemistry keep the model up to date and capture seasonal raw material fluctuations.
A Complete Example: Fat Standardization in a Dairy
The journey of milk from the farm to the filling line shows how deeply NIR spectrometry can intervene in a modern food process:
-
Milk intake: The tanker truck discharges the raw milk. An inline spectrometer measures fat and protein in the flow. These values determine the milk payment accounting. A second instrument checks for adulteration (water addition, foreign fat).
-
Centrifuge: The raw milk is separated into skim milk (< 0.1% fat) and cream (approx. 35% fat). Two NIR instruments measure both streams; the fat content of the cream determines how much cream must later be returned to the standardization.
-
Standardization tank: Skim milk and cream are combined so that the drinking milk exactly reaches the declared fat content (e.g. 3.5% whole milk, 1.5% semi-skimmed milk). A bypass NIR instrument continuously measures the current fat and protein content and adjusts the mixing ratio accordingly.
-
Filler: Before filling, a final NIR spectrometer checks the end product. If the fat content is within the tolerance range, it is released. Otherwise, deviations trigger a return to the standardization tank.
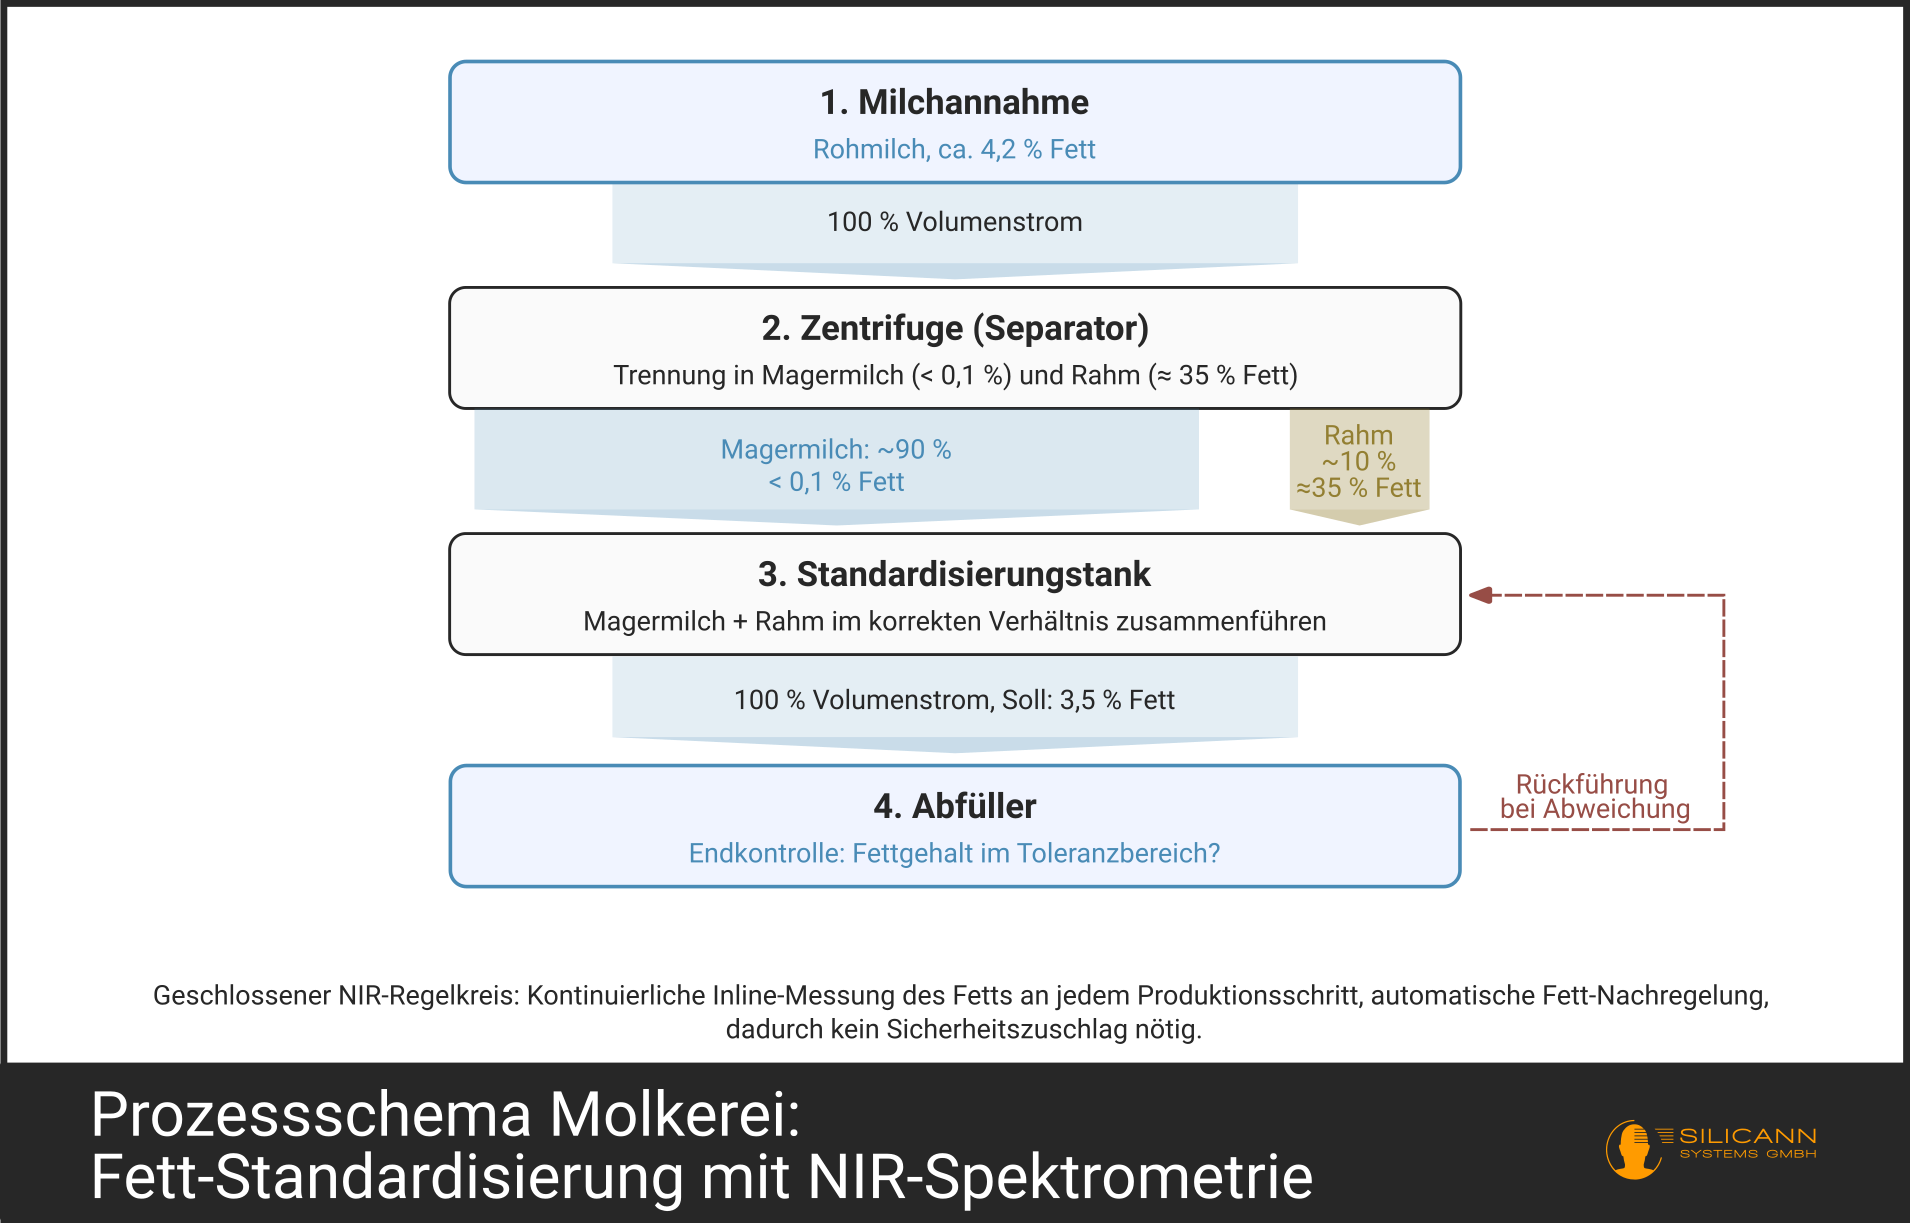
This system uses valuable raw materials very sparingly. The traditional "fat safety margin" -- intentionally running the fat content slightly above the declared value so as never to fall below the legal tolerance limit -- becomes superfluous through inline control. For a medium-sized dairy with an annual production of 500 million litres, a saving of 0.1% fat corresponds to around 500 tonnes of butterfat -- enough for about 2 million packs of butter.
Limits and Challenges
As powerful as NIR spectrometry is in the food industry, it also has systematic limits:
Heterogeneous samples: Whole grains, coarsely chopped meat, or non-uniform powder mixtures scatter the measurement light strongly and irregularly. If the samples are not sufficiently homogenized or the measurement is not repeated sufficiently often, the prediction accuracy drops noticeably. For process control, this means: either position the sight glass so that freshly ground, still homogeneous material passes by, or work with broad measurement spots that average over the inhomogeneities.
Calibration maintenance: Raw material qualities fluctuate seasonally. Milk from summer feeding (fresh grass) has a different fatty acid pattern than milk from winter feeding (silage). Wheat from a dry region differs in protein content and kernel hardness from wheat from a humid region. The calibration model ages with every new harvest and every new grazing season; it should ideally be refreshed periodically with new reference samples. Well-run operations plan this refreshment as a routine process and feed the model a few dozen newly analysed samples on a quarterly basis.
UV limits: UV process spectrometry is restricted in the food industry to clear, low-scattering media. With turbid milk or opaque meat emulsion, UV transmission is practically zero; here, NIR remains the only optical window. Even with edible oils, the UV measurement cell must be flushed at regular intervals, because the finest deposits settle on the quartz windows and drastically reduce transmission in the short-wave UV. In the edible oil industry, an automatic flushing cycle after each batch has proven successful for UV measurement.
Summary
NIR process spectrometry is today an integral part of industrial food production. It measures the key quality parameters, fat, protein, moisture, within a few seconds, inline in the product stream, without chemical waste. The NIR bands of OH, CH, and NH groups cover practically all food constituents, from milk fat to wheat protein to pea protein isolate.
In addition, UV spectrometry provides added value where oxidation products such as conjugated dienes (232 nm) and trienes (268 nm) become selectively visible, particularly in edible oil quality control.
With robust process spectrometers, well-designed inline measurement technology, and carefully maintained calibration models, spectrometry is the backbone of modern food quality assurance.
| Feature | Spektralwerk 15 Core NIR |
|---|---|
| Wavelength range | 900-1700 nm |
| Detector array | InGaAs, 256 pixels |
| Signal-to-noise ratio (SNR) | up to 10000:1 |
| Sample rate / spectra per second | > 500 Hz (streaming mode) |
| Trigger in and trigger out | yes |
| Spectral resolution (FWHM) | 3.9 nm (Hg line at 1014 nm) 5 nm (Hg line at 1529.6 nm) |
| Interfaces | Ethernet, FC (SMA on request) |
| Operating temperature | -5°C to +30°C |
| Ingress protection | IP40 (higher on request) |
| Details | Learn more |
Looking for an NIR spectrometry solution?
Thank you for your message!
We will get back to you as soon as possible.
Unfortunately, we were unable to transmit your message.
A technical error occured. Please try again later — or send an email to sales@silicann.com.
Thank you for your understanding.