How UV Spectrometry Works
Whether in a biochemistry lab, a pharmaceutical quality control department, or water monitoring: UV spectrometry is indispensable in modern analytics. While NIR spectrometry works with molecular vibrations, UV spectrometry goes one level deeper: to the electrons themselves. Let's take a closer look at what happens on this physical level.
Electrons and Their Energy Levels
Anyone who paid attention in chemistry class remembers: electrons orbit the atomic nucleus in orbitals. What often gets overlooked: these orbitals aren't arbitrary paths; they are precisely defined energy levels. And that's precisely where the story of UV spectrometry begins.
As soon as atoms bond with each other, their atomic orbitals overlap and form molecular orbitals. Unlike isolated atoms, there are now three types, which differ in energy.
Bonding orbitals are formed when the wave functions of atomic orbitals overlap constructively -- figuratively speaking, the electron clouds add up between the atomic nuclei. The result is an orbital with lower energy than the two original atomic orbitals. Electrons residing here stabilize the molecule. The σ orbitals (sigma, [ˈzɪɡmə]) of a single bond or the π orbitals (pi, [paɪ]) of a double bond fall into this category.
Antibonding orbitals (marked with an asterisk: σ* [sigma-star], π* [pi-star]) are the counterpart. They form through destructive overlap of the wave functions: a nodal plane without electron density develops between the atomic nuclei. Since the electrons no longer shield the nuclei, the positively charged nuclei repel each other more strongly. The orbital is elevated in energy and unoccupied in the ground state. Antibonding orbitals are the "target line" of an electronic transition.
Nonbonding orbitals, simply called n orbitals (pronounced: en, [ɛn]), are a special case. They don't arise from the overlap of atomic orbitals but exist as residual atomic orbitals not involved in bonding at all. The classic example is the lone electron pairs of oxygen in a carbonyl group (C=O): the oxygen brings two electron pairs that participate in no bond, but play a major role in UV spectrometry -- more on that shortly.
In the ground state, electrons occupy the lowest available energy levels. The highest occupied orbital is called HOMO (Highest Occupied Molecular Orbital), the lowest unoccupied orbital LUMO (Lowest Unoccupied Molecular Orbital).
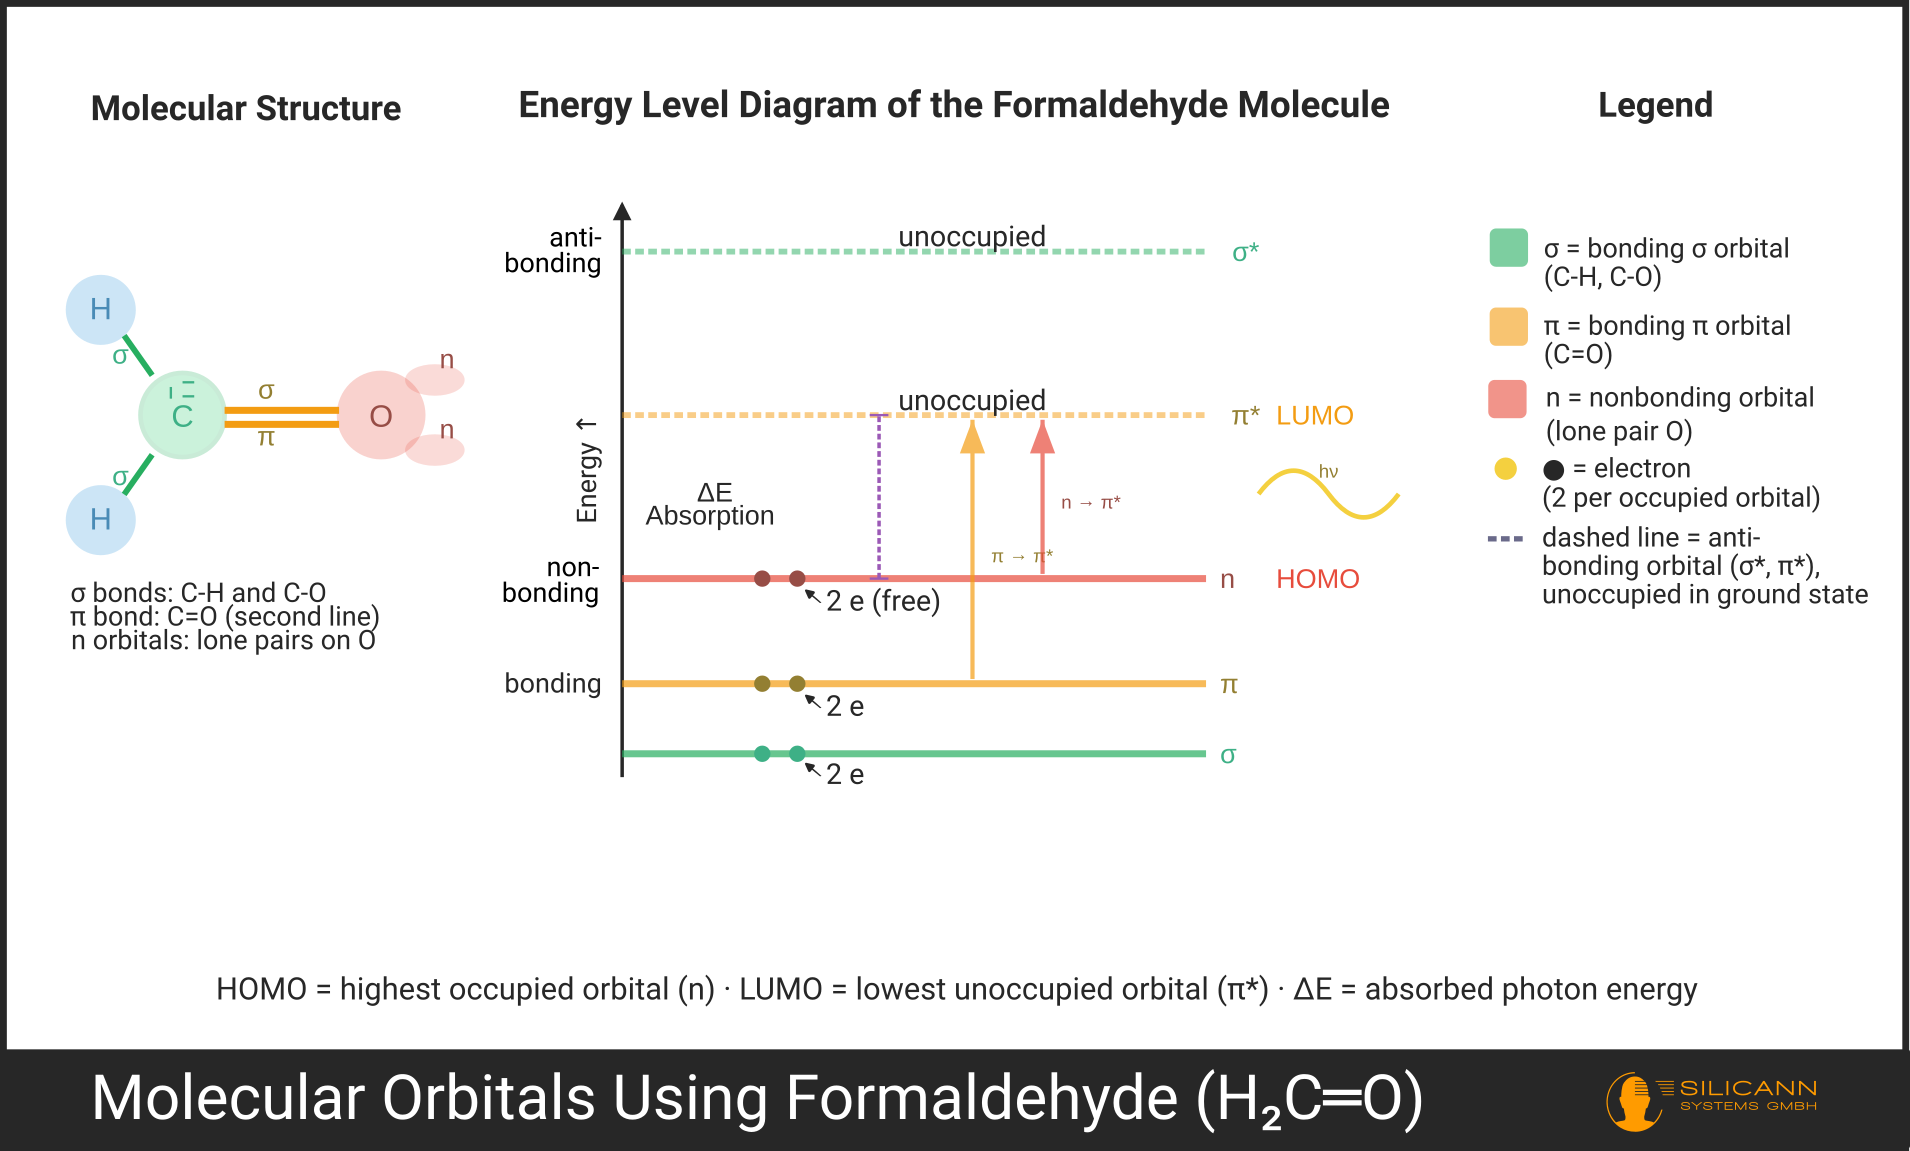
The energy gap between HOMO and LUMO is the decisive factor for UV spectrometry, because this gap determines exactly which wavelength a molecule can absorb.
How Molecules Absorb UV Radiation
When electromagnetic radiation strikes a molecule, an electron can absorb the energy of a photon and jump from an occupied orbital to an unoccupied one: out of the ground state into an excited state. This is the central process of UV spectrometry.
The condition: the photon's energy must match the energy gap between the two orbitals exactly. If the photon delivers too little or too much energy, the result is: nothing. The molecule remains in its ground state. The same strict quantum rules apply here as for molecular vibrations in infrared spectrometry.
The energy of a photon depends on its wavelength:
\(E = \frac{h \cdot c}{\lambda}\)
The rule of thumb: the shorter the wavelength, the greater the photon's energy. UV radiation (200-400 nm) is shorter in wavelength than visible light and thus carries enough energy to make electrons jump between orbitals. Visible light, and even more so infrared radiation, is energetically insufficient for this task; here, molecular vibrations dominate, as described in the article on fundamental vibrations and overtones.
The Quantum Level
Anyone who sees their first UV spectrum and finds distinct peaks instead of a smooth curve inevitably asks: why doesn't the molecule simply absorb all wavelengths to some degree?
The answer is a quantum mechanical effect that comes with the blueprint of the universe. Electrons simply cannot absorb arbitrary amounts of energy by the bucketload; their orbitals can only be switched in discrete jumps -- an insight that Nils Bohr first formulated mathematically at the beginning of the 20th century using the hydrogen atom.
Photons whose energy does not exactly match an allowed transition pass right through the molecule unimpeded. The result is a spectrum in which absorption occurs only at very specific wavelengths.
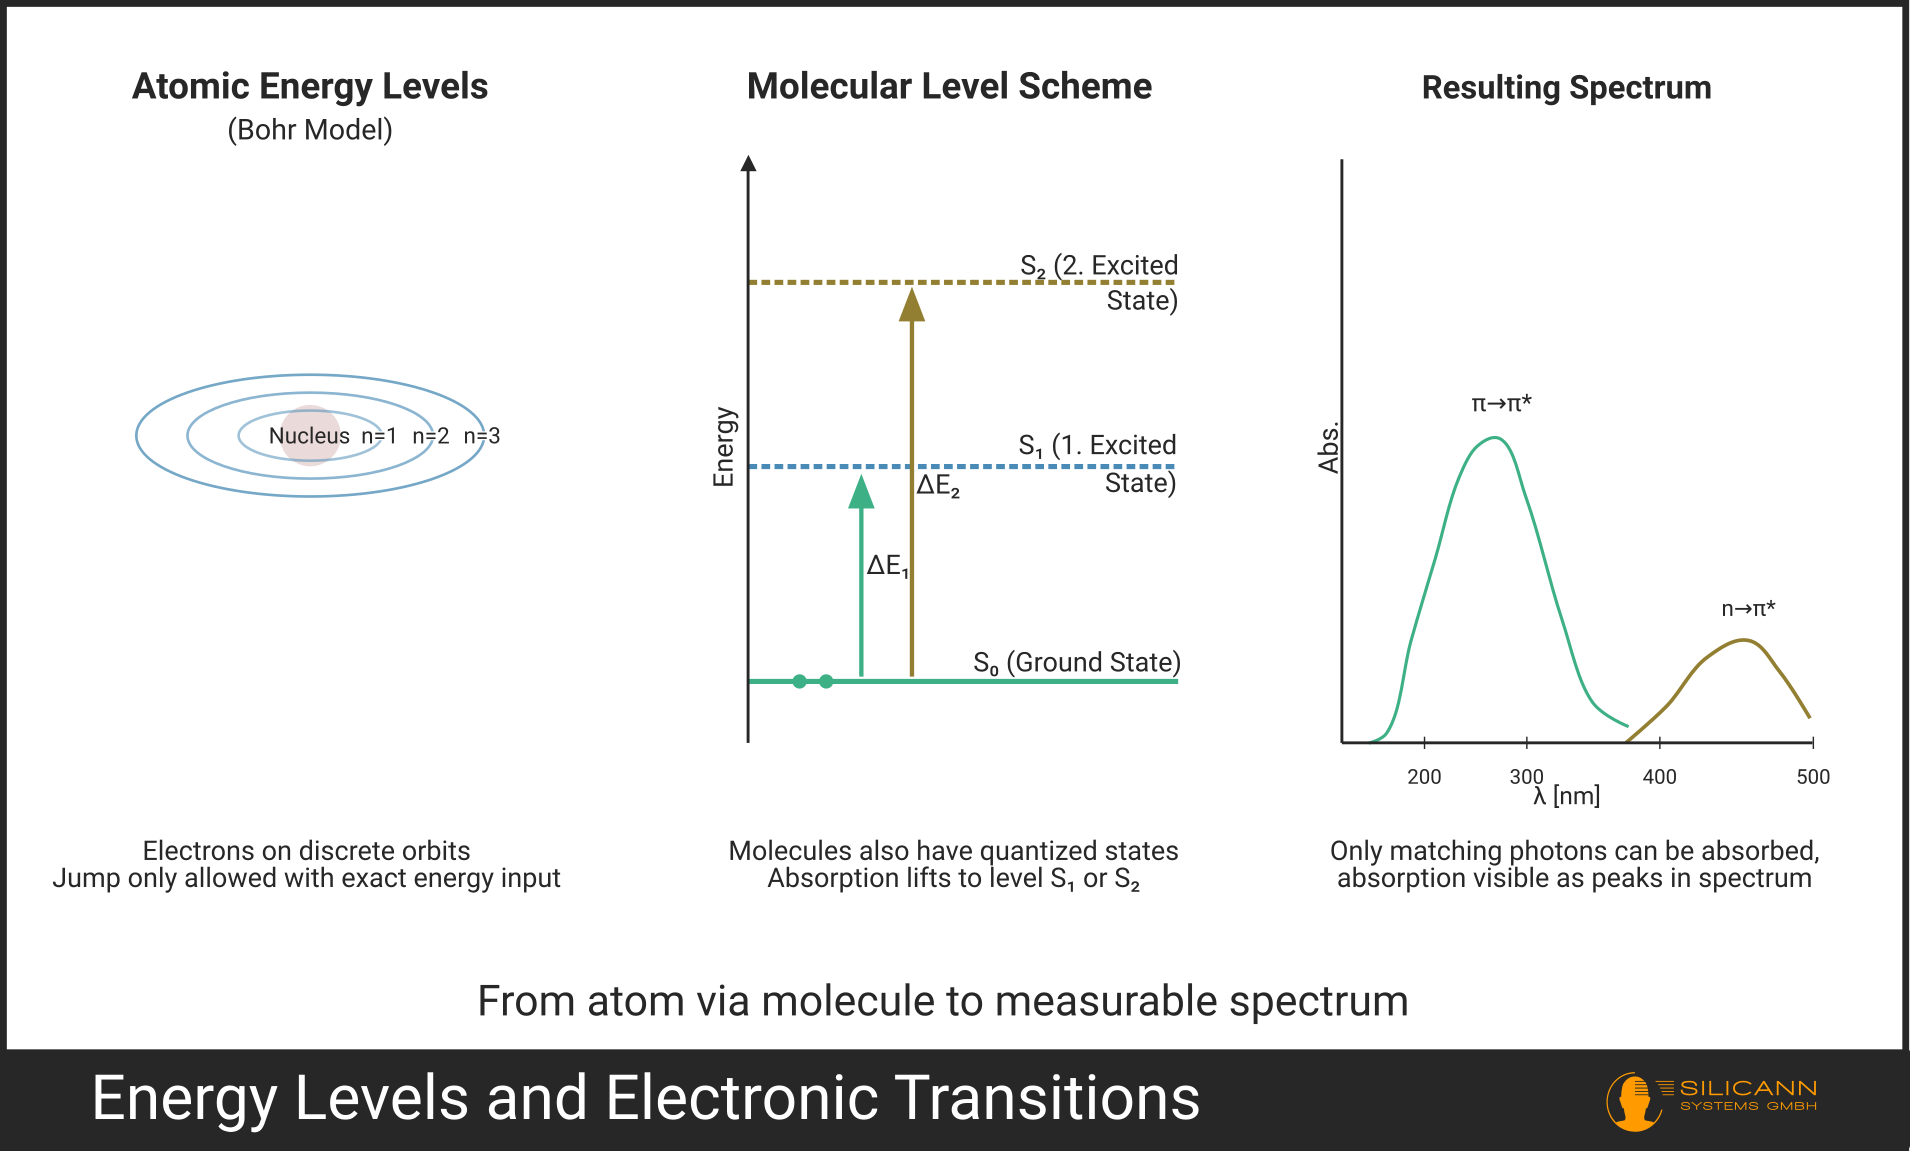
A closer look at a real UV spectrum reveals something else: no collection of razor-sharp lines, as known from atomic spectra. Instead, we see broader bands. Why? Each electronic transition is accompanied by a multitude of simultaneous vibrational and rotational excitations of the molecule. The individual, slightly offset transitions overlap and merge into a broad band. What sounds like a downside in resolution is, from the perspective of routine analytics, a gift: with very narrow atomic lines, it would be barely feasible to work in everyday practice. The reason: atomic peaks are often only fractions of a nanometer wide. A spectrometer that could resolve such fine details would be too expensive and delicate for practical use. Even a slight temperature change can minimally detune the grating; with a 20 nm wide band, you wouldn't notice, but with a 0.1 nm wide line, the peak disappears completely. For concentration measurements, you would also have to hit the peak maximum exactly, whereas a broad band delivers stable and reproducible readings even with slight wavelength deviations. In short, molecular bands are not a bug but a feature: they make UV spectrometry robust enough for process monitoring with affordable hardware.
Types of Electronic Transitions
Not every electron can be excited by UV radiation. Which transitions are possible depends on the electronic structure of the molecule. Four main types are distinguished (the arrow →, read as "to", marks the electron's path from the starting orbital to the target orbital):
| Transition | Description | Typical Wavelength | Example |
|---|---|---|---|
| \(\sigma \rightarrow \sigma^*\) | Bonding electron of a single bond jumps into the antibonding orbital | < 200 nm (vacuum-UV) | C-H, C-C single bonds |
| \(n \rightarrow \sigma^*\) | Lone electron pair jumps into the antibonding σ-orbital | 150-250 nm | H₂O, alcohols, ethers |
| \(\pi \rightarrow \pi^*\) | π-electron of a double bond jumps into the antibonding π-orbital | 200-700 nm | C=C, C=O, aromatics |
| \(n \rightarrow \pi^*\) | Lone electron pair jumps into the antibonding π-orbital | 250-600 nm | C=O, N=N, nitro compounds |
\(\sigma \rightarrow \sigma^*\) transitions require the most energy. They lie in the far UV range below 200 nm, which is only accessible with vacuum spectrometers -- hence the name "vacuum-UV". They play almost no role in routine UV spectrometry.
The most practically important transitions are \(\pi \rightarrow \pi^*\) and \(n \rightarrow \pi^*\). They lie in the measurable UV range (200-400 nm) and are characteristic of molecules with double bonds -- meaning virtually all organic substances of interest.
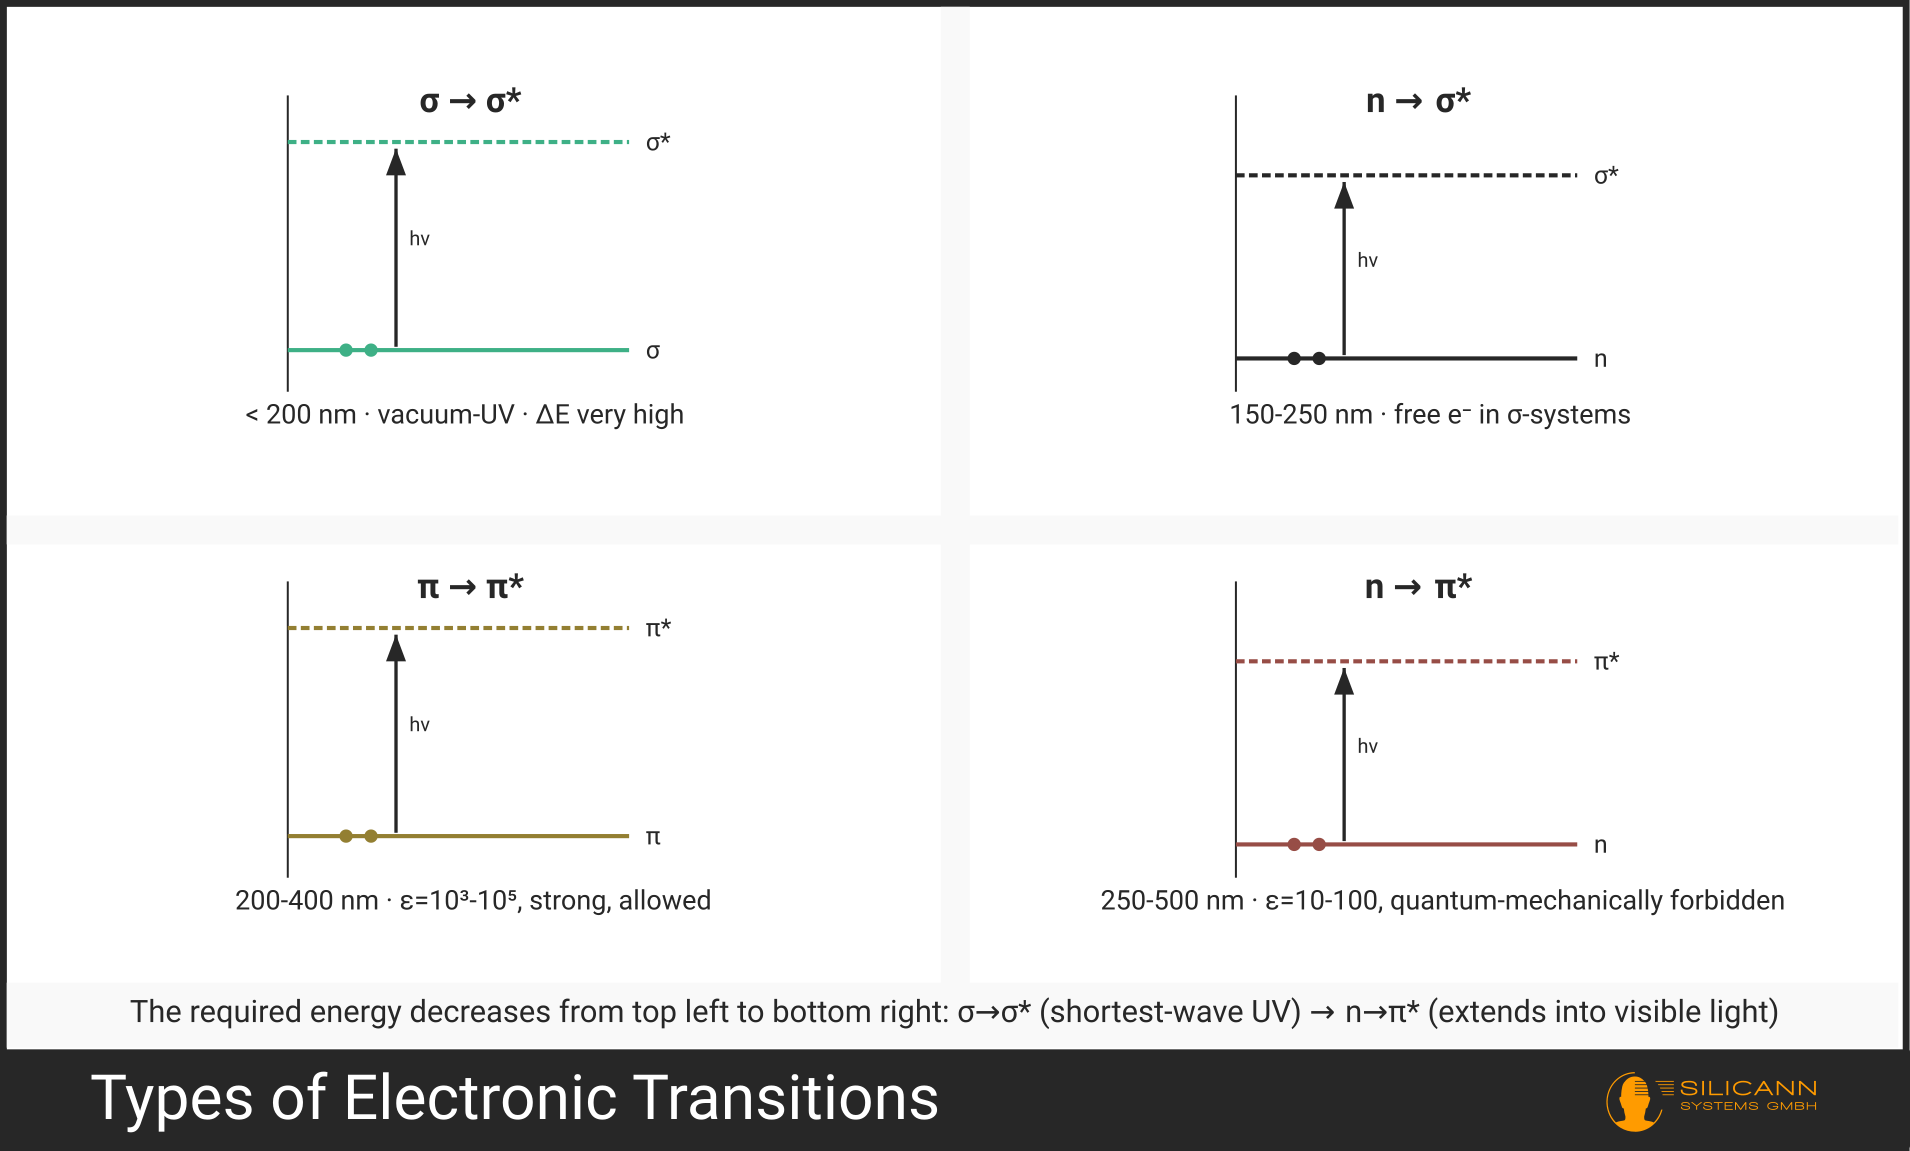
The \(n \rightarrow \pi^*\) transition is particularly interesting: it is quantum mechanically "forbidden" (formally of low probability) but still occurs, just with correspondingly weaker intensity. This distinguishes it at a glance in the spectrum from the allowed \(\pi \rightarrow \pi^*\) transitions of the same molecule.
Chromophores and Auxochromes
Not every molecule is visible in a UV spectrometer. So: which ones are? The magic word is chromophore (literally "color bearer"). The term originates from VIS spectroscopy, but its principles can be transferred one-to-one to the UV range.
A chromophore is a functional group that absorbs electromagnetic radiation. In UV spectrometry, these are primarily groups with π-electrons:
- Simple chromophores: The carbonyl group C=O (π→π* and n→π*), the nitro group NO₂, the azo group N=N, the imine C=N.
- Conjugated systems: Multiple double bonds alternating with single bonds (C=C-C=C-C=C ...). The longer the conjugated system, the lower the required excitation energy and the further the absorption migrates toward longer wavelengths. As a rough rule of thumb: with about 8 conjugated double bonds, absorption often shifts far enough to reach the visible range -- the molecule appears colored. However, the transitions here are fluid.
- Aromatics: Benzene and its derivatives have characteristic π→π* absorptions that become increasingly complex with additional substitution.
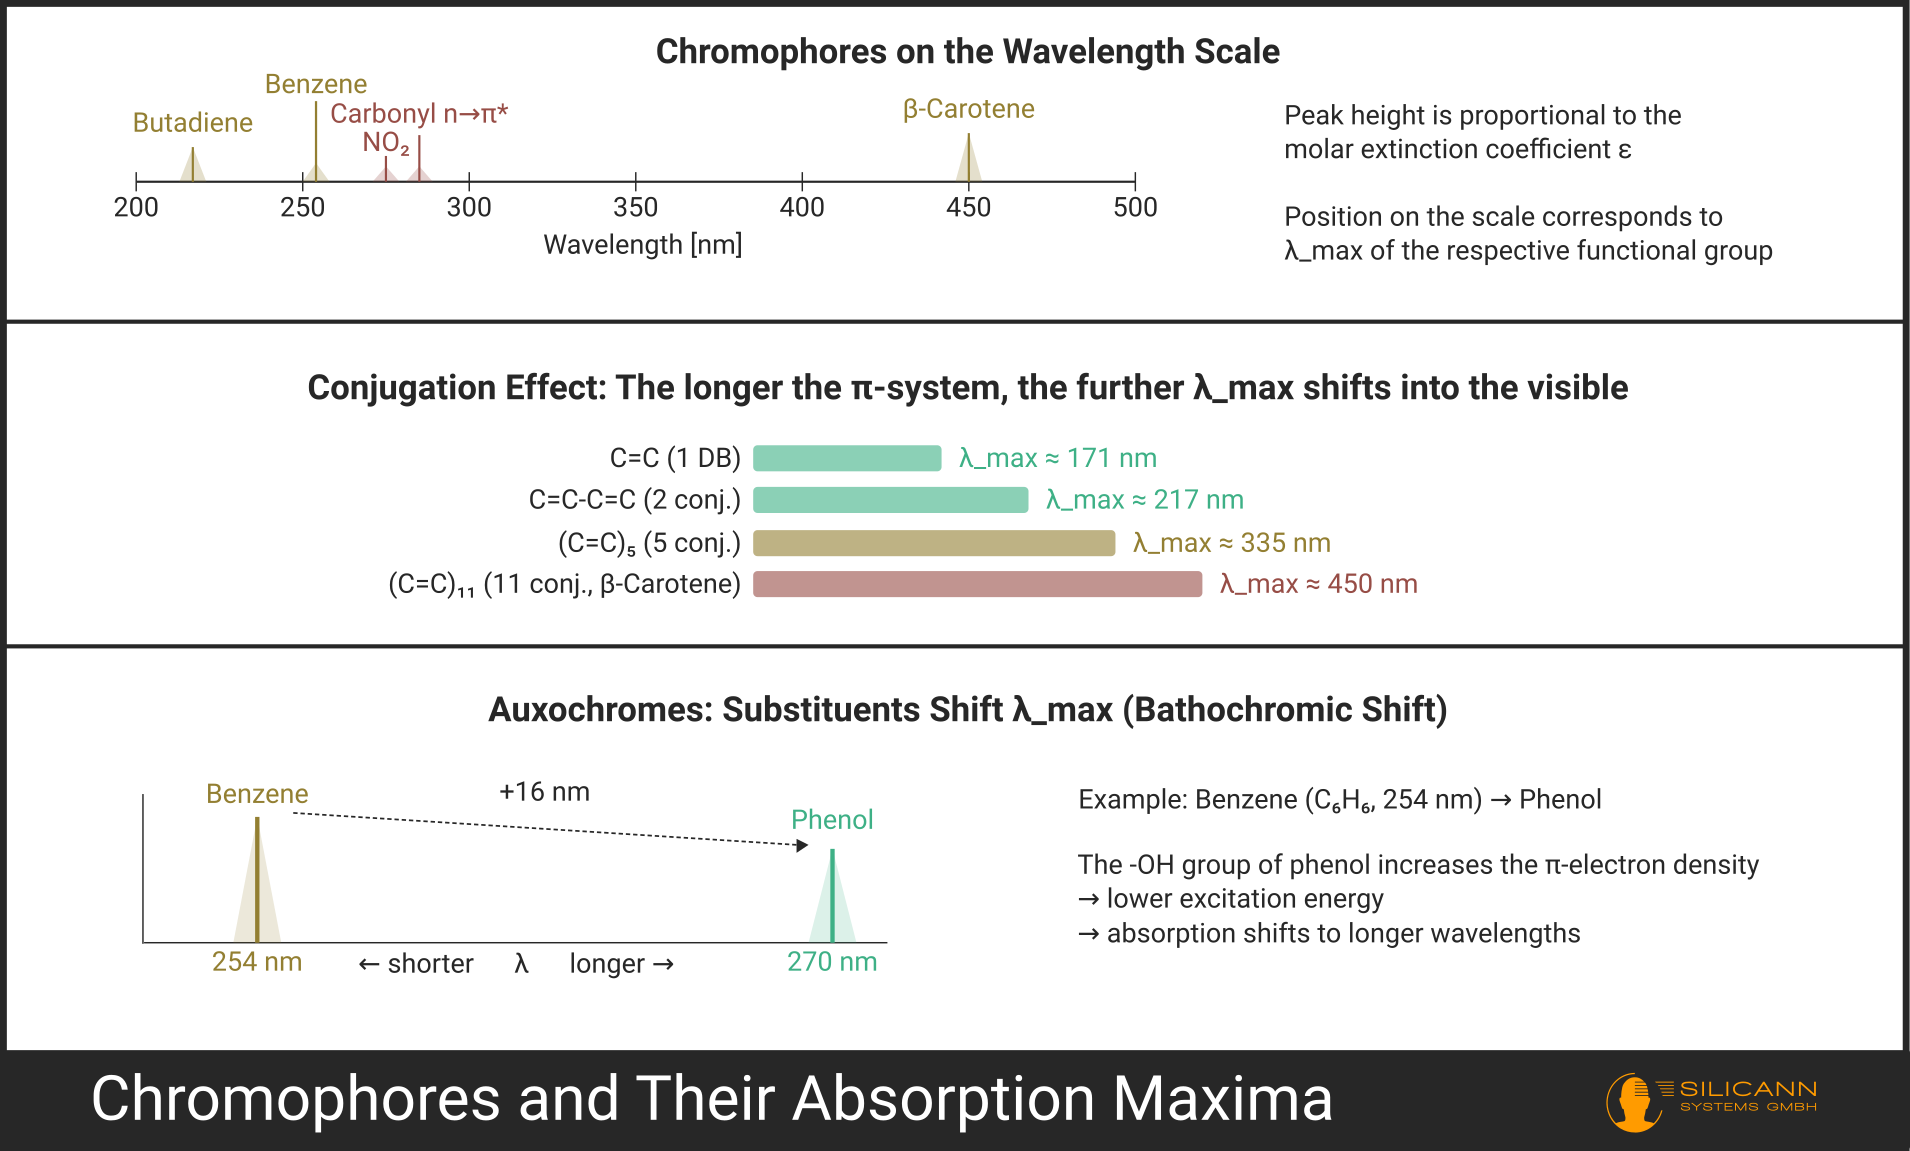
Auxochromes are substituents with lone electron pairs (such as -OH, -NH₂, -OCH₃, halogens) that do not themselves absorb in the UV but influence the absorption of neighboring chromophores. They shift the absorption maximum and alter the intensity. In chemical terms: they increase the electron density in the conjugated system and thereby lower the excitation energy.
Solvent Effects
Many underestimate the role of the solvent. Yet it is anything but a passive spectator. It changes both the precise position and the shape of absorption bands -- an effect the scientific community calls solvatochromism.
The most important effects:
- Bathochromic shift (red shift): The absorption maximum moves to longer wavelengths. This occurs especially with \(\pi \rightarrow \pi^*\) transitions in polar solvents, because the excited state is stabilized more than the ground state.
- Hypsochromic shift (blue shift): The maximum moves to shorter wavelengths. Typical for \(n \rightarrow \pi^*\) transitions in protic solvents (such as water or ethanol), because the lone electron pair is stabilized by hydrogen bonds in the ground state.
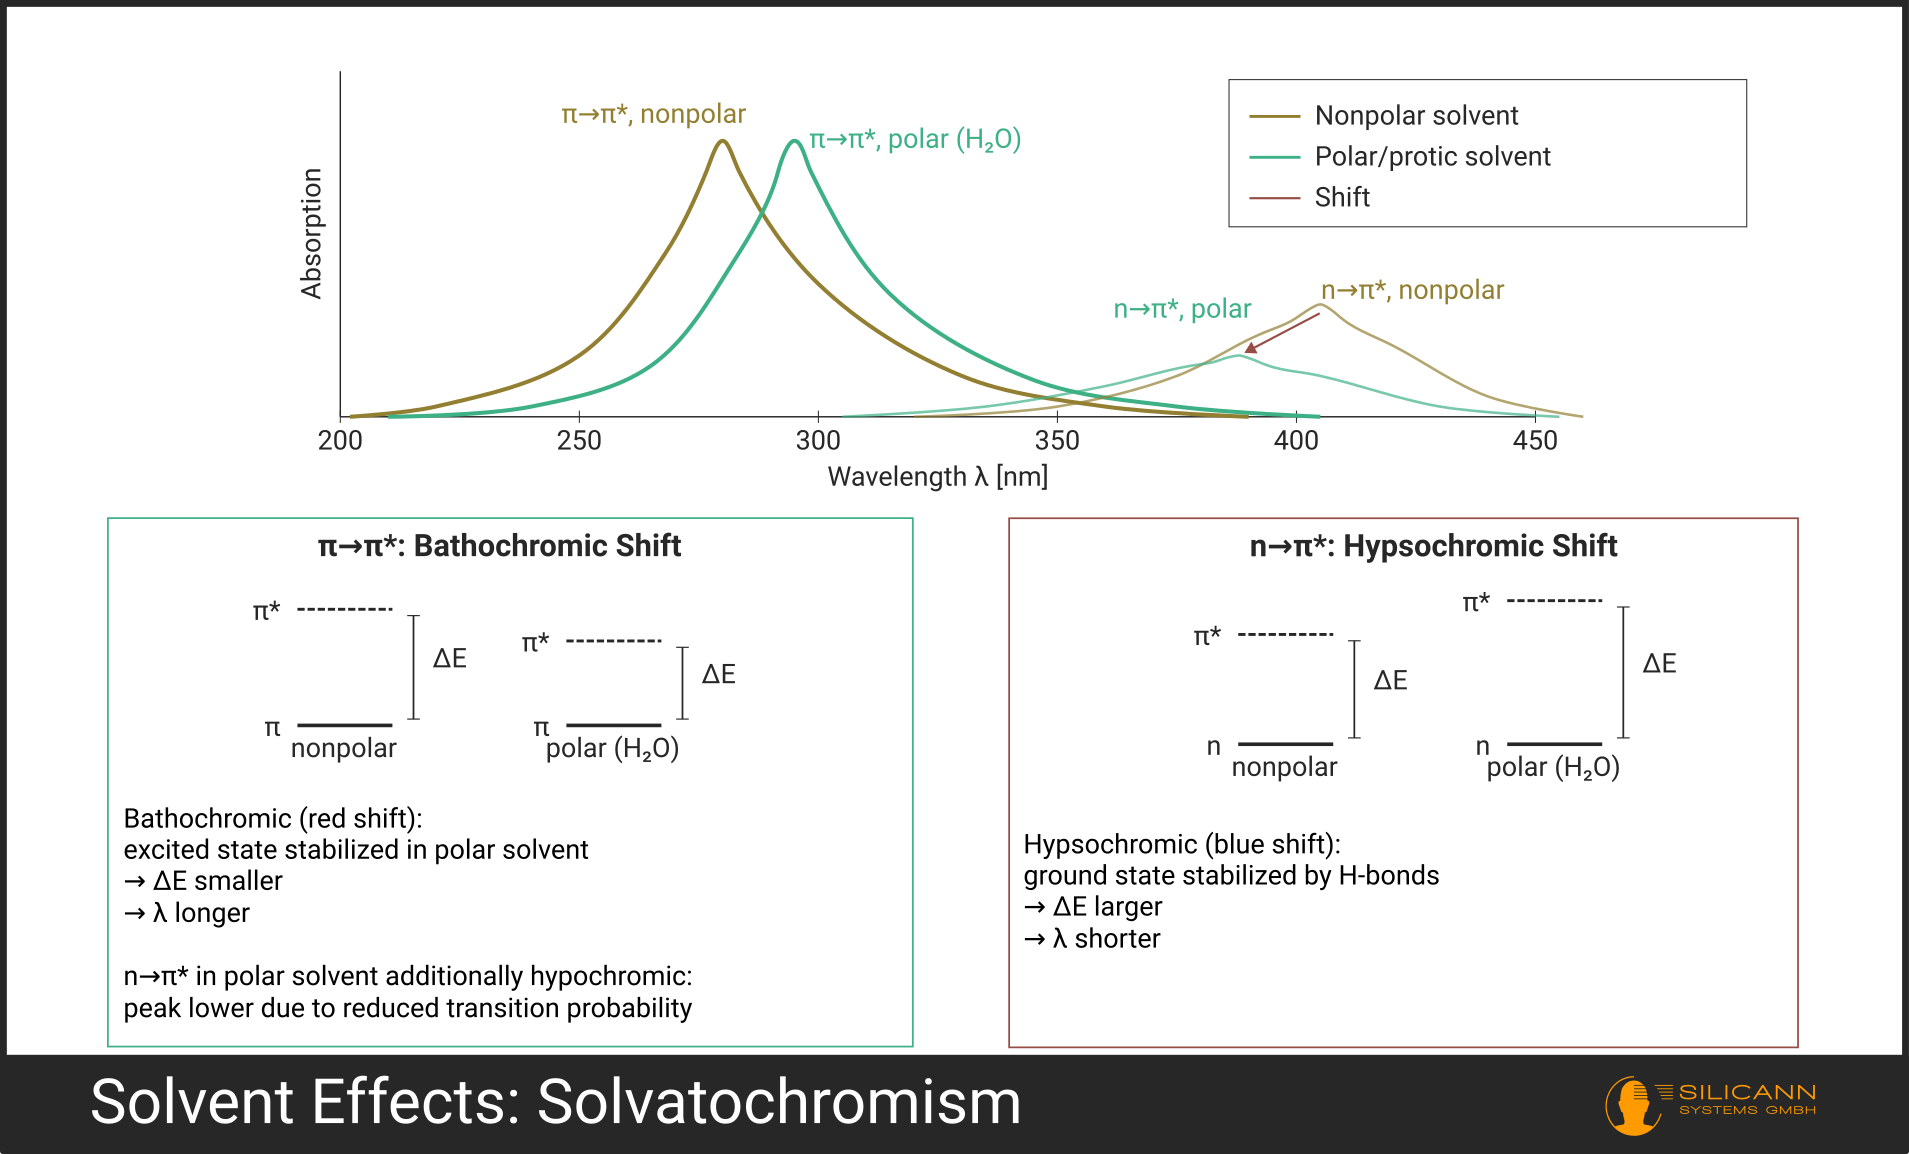
There are also hyperchromic (more intense absorption) and hypochromic effects (weaker absorption), which arise from altered transition probabilities due to the solvent environment.
In short: without specifying the solvent, a UV spectrum is, strictly speaking, incomplete. In practice, the measurement is therefore referenced against the pure solvent (so-called "baseline subtraction"), so that the solvent's own absorption is removed from the result.
UV Compared to VIS and NIR
The various ranges of optical spectroscopy differ not only in wavelength; they are based on fundamentally different physical mechanisms.
| Range | Wavelength | Physical Process | Typical Information |
|---|---|---|---|
| UV | 200-400 nm | Electronic transitions | Chromophores, conjugation, aromatics |
| VIS | 400-780 nm | Electronic transitions | Color, metal complexes, conjugates |
| NIR | 780-2500 nm | Molecular vibrations (overtones) | OH, CH, NH, functional groups |
| MIR | 2500-25.000 nm | Molecular vibrations (fundamental vibrations) | Detailed structural analysis |
In UV spectrometry, one looks at the electronic structure of a molecule -- the π-system and the degree of conjugation. In NIR spectrometry, on the other hand, the focus is on the mechanical vibrational structure.
Both methods complement each other. Due to their very high molar extinction coefficients, UV measurements are extremely sensitive and are excellently suited for trace analysis of specific groups. NIR, in contrast, provides a more holistic picture of molecular structure and is unbeatable for quantitative analysis of complex mixtures.
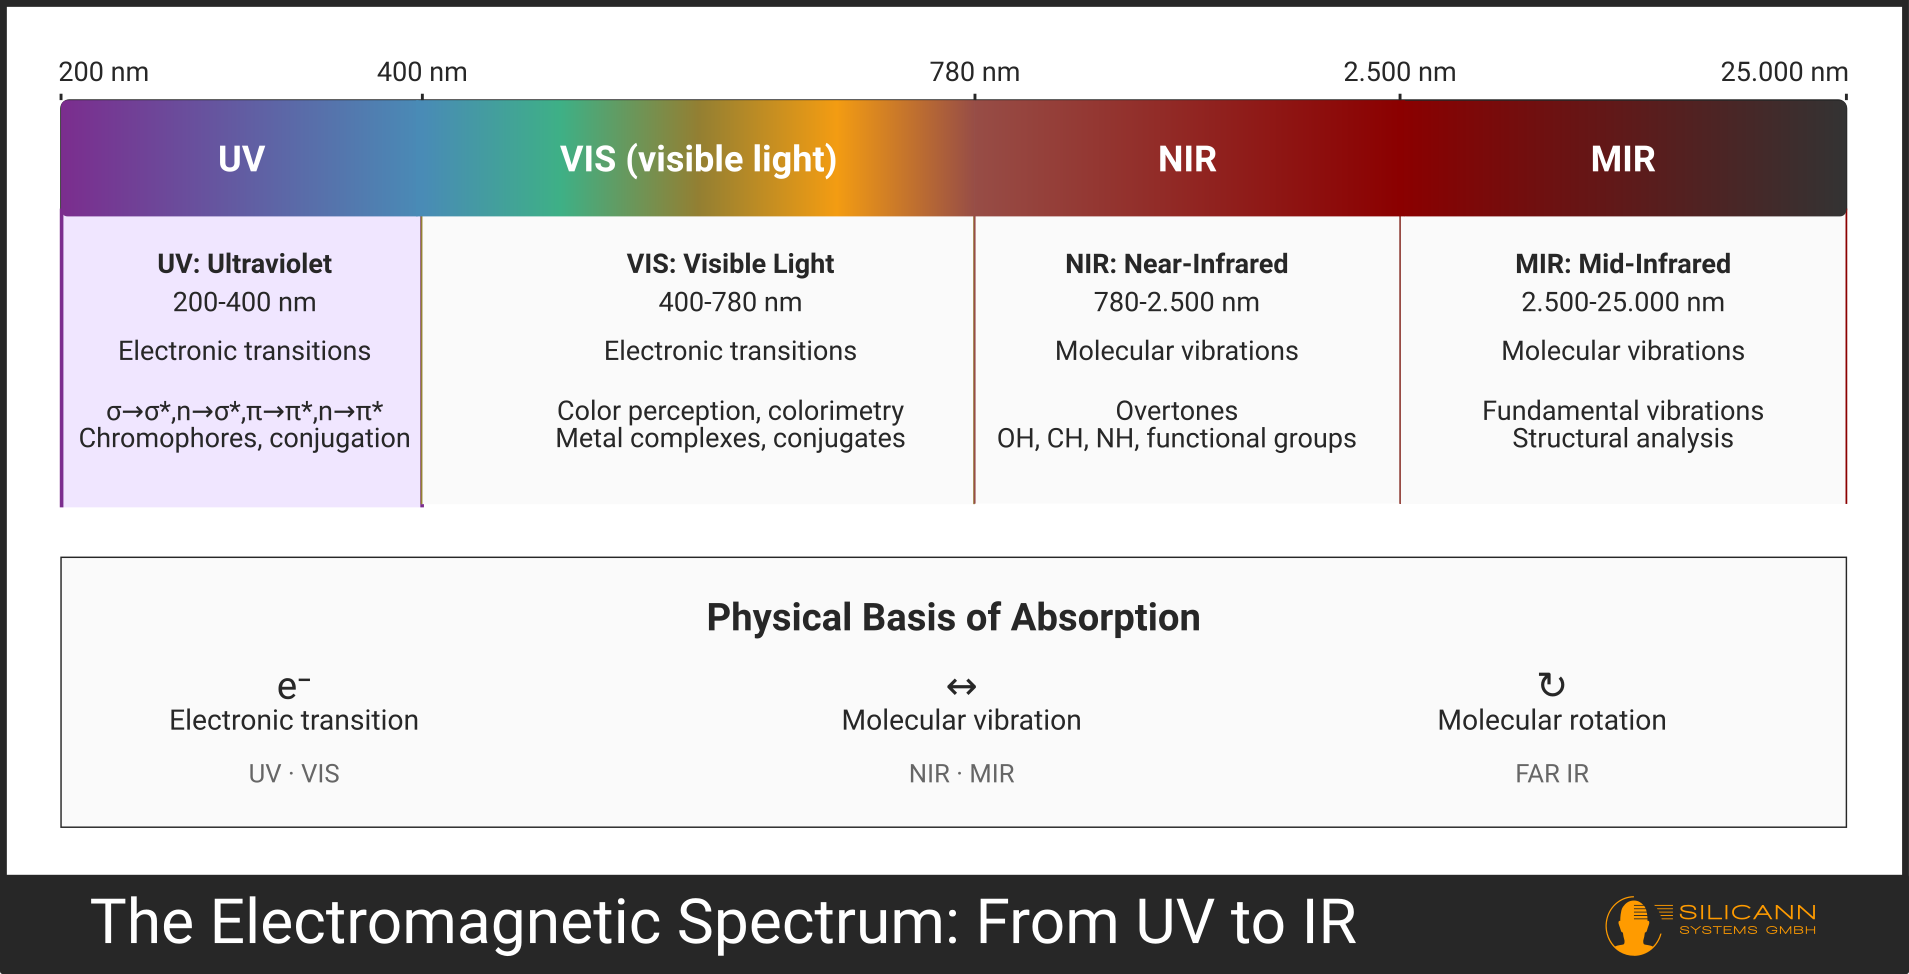
One advantage of UV spectrometry: the molar extinction coefficients of electronic transitions (\(10^3\)-\(10^5\) L·mol⁻¹·cm⁻¹) are orders of magnitude higher than those of vibrational transitions in NIR spectrometry. UV measurements are therefore generally far more sensitive. This is the reason the method is so excellently suited for quantitative analysis, often already in the trace range.
From Physics to Measurement: The Beer-Lambert Law
Before we get to applications, one important piece of the puzzle is missing: how does a jumping electron become a concrete concentration value? The spectrometer initially measures only how much light passes through the sample -- the transmittance (\(T\)). From this, it calculates the absorbance (\(A\)) logarithmically. In everyday lab work and in pharmacopoeias, the term "extinction" is often used synonymously here, since this term additionally encompasses light scattering by particles.
The relationship between this measured light attenuation and the concentration is the core of quantitative spectrometry: the Beer-Lambert law.
\(A = \varepsilon \cdot c \cdot d\)
Absorbance (\(A\)) is the product of the molar extinction coefficient (\(\varepsilon\)), the concentration (\(c\)), and the path length of the cuvette (\(d\)). It is a wonderfully simple, linear law: double the concentration means double the absorbance.
Physically, this law applies across the entire spectral range. If the calibration curve in the lab sometimes flattens at very high concentrations, it's not the law itself that's at fault, but the limits of measurement reality: stray light in the instrument, non-ideal monochromatic light, or physical interactions of the molecules in overly dense solutions interfere with the linearity. But if you stay within the range of dilute, clear solutions, the Beer-Lambert law is a rock-solid anchor.
Applications of UV Spectrometry
Hardly any analytical laboratory manages without UV spectrometry. A look at the most important fields of application shows why:
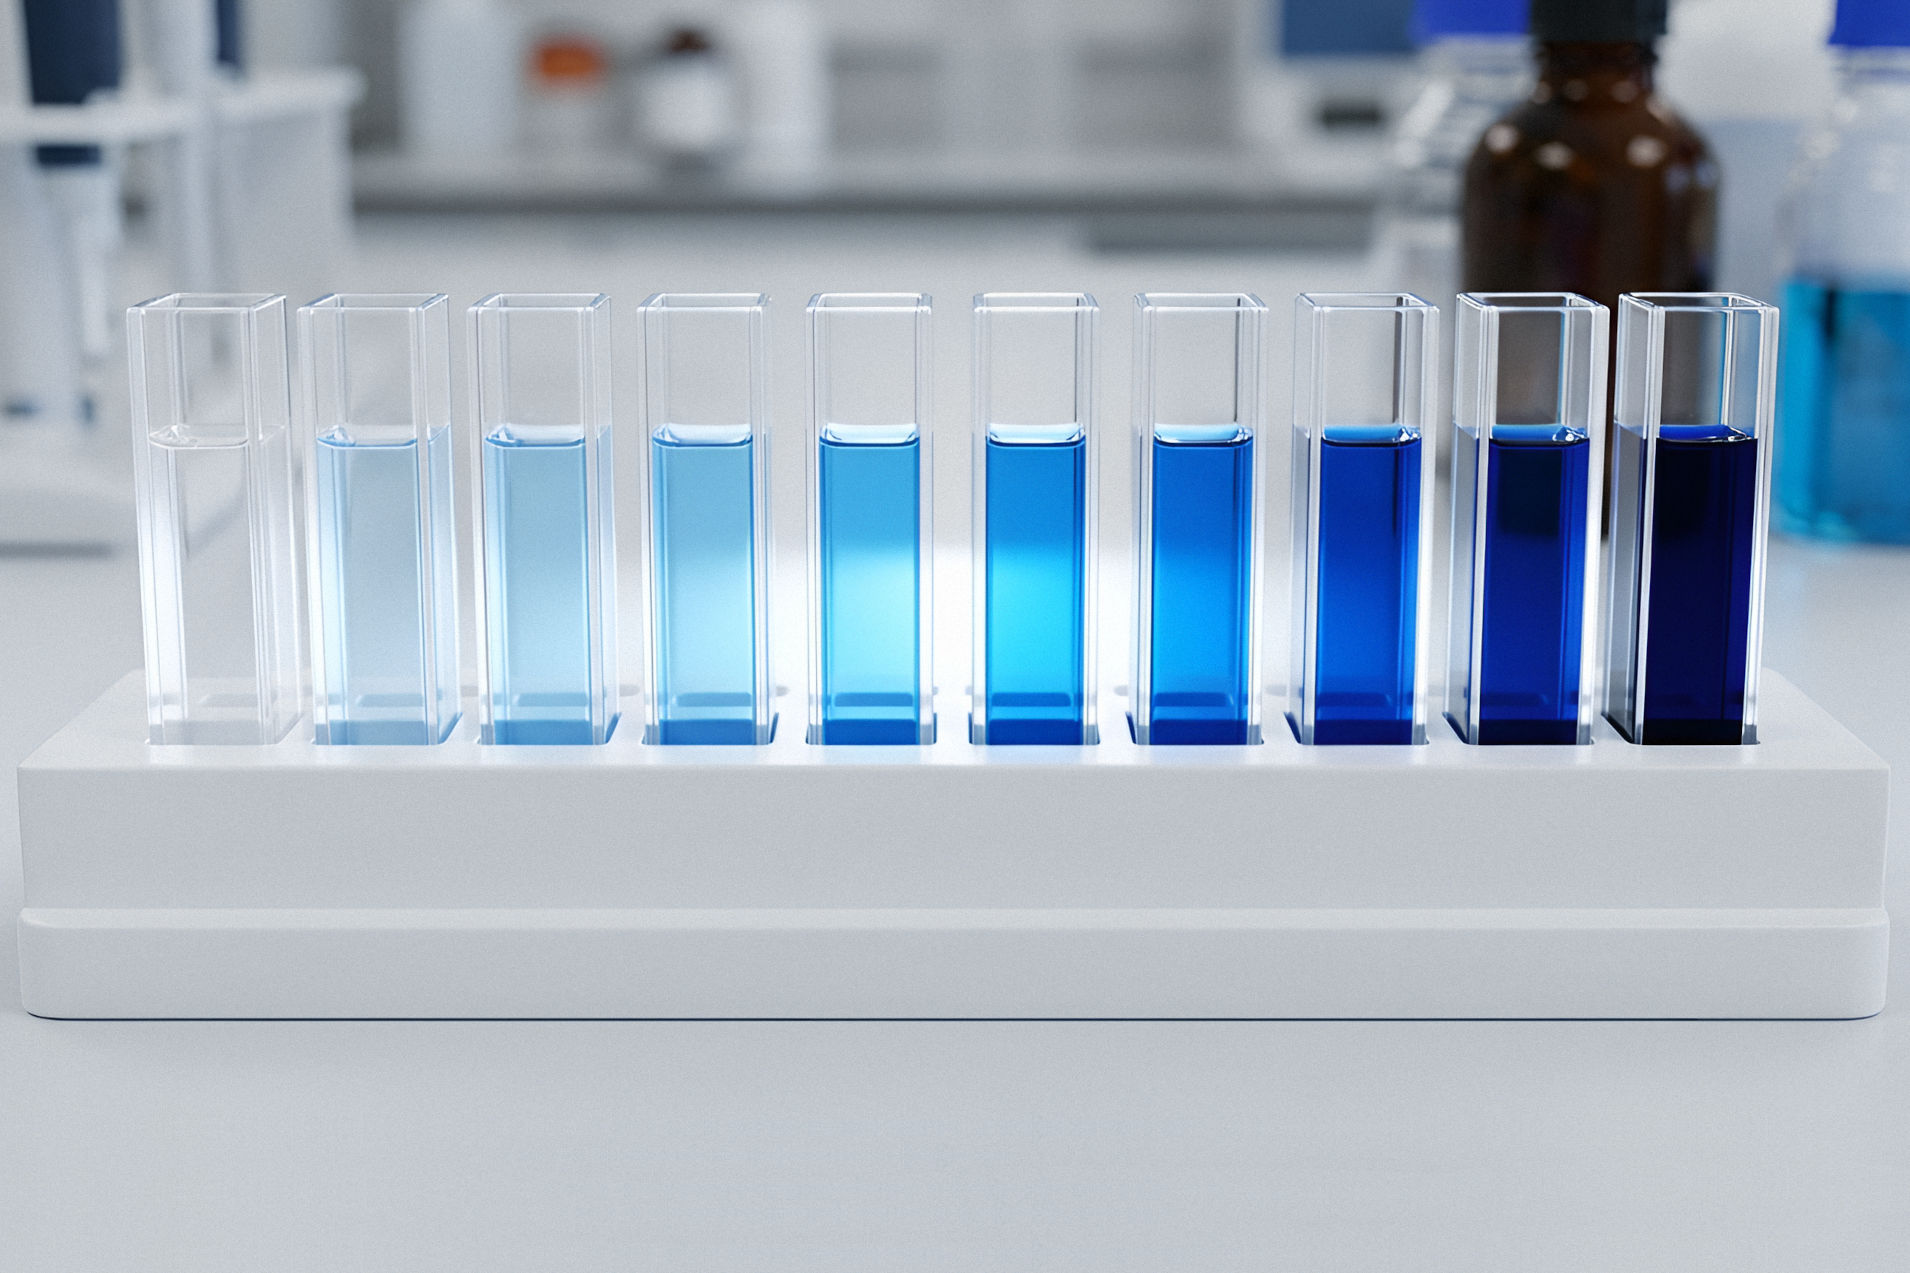
- Concentration measurements: The strength of absorption is proportional to the concentration of the absorbing substance. Concentrations can thus be measured directly: quickly, non-destructively, and with straightforward linear calibration. In contrast to NIR spectrometry, which often requires complex chemometric models, a simple dilution series usually suffices as a reference here.
- Purity testing and quality control: Many pharmaceuticals, dyes, and food additives have characteristic UV spectra. Deviations indicate impurities.
- Monitoring chemical reactions: If an educt peak disappears or a product peak appears, the reaction progress can be tracked in real time -- the foundation of reaction kinetics.
- Protein and DNA quantification: Proteins absorb at 280 nm (aromatic amino acids), DNA at 260 nm. UV spectrometry is the standard method for concentration determination in biochemistry and molecular biology.
- Water analysis: Nitrate, nitrite, dissolved organic substances, and many pollutants absorb in the UV and can thus be detected directly in water.
The hardware ranges from classic laboratory spectrometers to compact, process-integrated inline spectrometers that measure continuously in the process, enabling real-time production monitoring.
That UV spectrometry is indispensable in these fields is not only due to its analytical strength but also to a pragmatic reason: the technology is highly mature. With robust deuterium lamps, quartz glass optics, and silicon detectors, a reliable and economical instrumentation is available. This is also why UV spectrometry plays a key role in automated process control.